Task 1
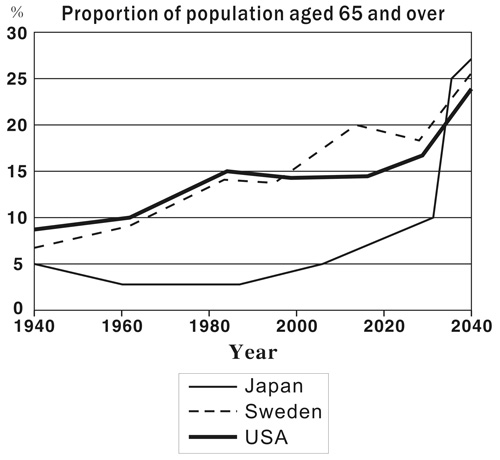
The graph below shows the proportion of the population aged 65 and over between 1940 and 2040 in three different countries. Summarise the information by selecting and reporting the main feature and make comparisons where relevant. (The graph is attached)
This graph illustrates the evolving trend of population aged 65 and over from 1940 to 2040 in Japan, Sweden, and USA.
In general, the proportion of population aged 65 and over in the three countries is expected to increase and reach to approximate 25 percent in 2040. The percentage of old people in Japan started form 5 percent in 1940 and slightly dipped into 2.5 or 3 percent during the next four decades before it raised to 10 percent in 2000. Moreover, the figure was expected to experience an dramatic increase to more than 25 percent in the next 40 years.
On the other hand, despite some fluctuations, the proportion of population aged 65 and over in the two Western countries shows the continuing upward trend through the century. The figure for Sweden, which started from nearly 8 percent in 1940, was predicted to reach to around 26 percent in 2040. Meanwhile, the rate of old people in USA, which was the highest among the three countries at the beginning with nearly 10 percent, may end up about 23 percent, the lowest proportion among three countries, in 2040.

203103_1_o.jpg
