Unanswered [0]
  

Home / Writing Feedback   % width   Posts: 4


The graph gives data on the amount of fish, lamb, beef, chicken consumed over a period of 15 years


qdark 1 / -  
Sep 12, 2020   #1

writing task 1- ielts - Fish and meet consumption


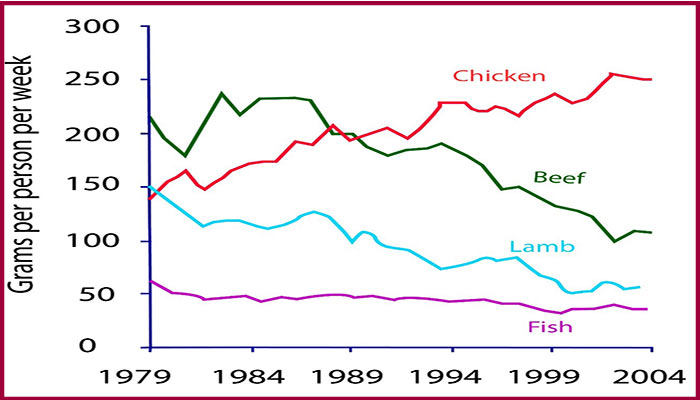
The given line graph gives data on the amount of fish, lamb, beef, chicken consumed over a period of 15 years in a European country.

It is clear that fish was always the lowest consumption during this time frame. In particular, the number of grams of beef and lamb fell, while the number of grams of chicken experienced a rise.

In the first year, 1979, more than 200 grams of beef was used per capital on a weekly basis followed by chicken and lamb. The figures for fish needs stood at around one third of that amount. There was no significantly difference from chicken and lamb consumption which had reached approximately 150 grams.

The year 2004 witnessed a growth of about 100 grams in the number of chicken use which was much higher than other categories. While the figure for beef ranked second with roughly 110 grams, a decrease compared to the 15 previous years. Lamb and fish made up the smaller share with just below 70 and 50 grams, respectively.

  • fishandmeatconsum.jpg


Holt  Educational Consultant - / 15461  
Sep 13, 2020   #2
Please limit your sentences to one thought process per presentation. Since the minimum sentence requirement for each of the 3-4 paragraphs is 3 sentences, no more than 5 sentences, you should aim for clarity in every sentence presentation. That is accomplished by creating a coherent paragraph. The coherent paragraph is based on the singular thought presentations per sentence in relation to the related topics for that paragraph.

Look at these sentence samples. Compare the clarity of these sentences with your presentation:

The line graph image provided data for the consumption of fish, lamb, beef, and chicken. The measurements were taken over a 15 year period. The information provided did not indicate any country in particular as the source of the information.

Based on the starting measurements from 1979, it appeared that beef was the most consumed at 200 grams per week. This was quickly followed by chicken and lamb at ... respectively. Fish, on the other hand...

Note the clearer presentation in the above examples when compared to your presentation. You need to find a uniform way of presenting the information to help keep a standard discussion format in your paper that focuses on clarity rather than the quantity of words. Note the crossover points in the graph where chicken and beef intersected and report on that as will be the comparison point of note in the presentation.
thaolinh 5 / 10  
Sep 16, 2020   #3
@qdark
Hello qdark. Although I just got a moderate ielts band score, I have some comment on your work
You can combined first two para because I think you are splitting too small your idea. The intro of task 1 can conclude the paraphrase of the question sentence and an overview sentence. My teacher said that is the best way to start a task 1 essay

For the body structure, I suggest another approach, that you can have the first para for the items have upward trend, and the second for the category with the opposite trend

You made some spelling and word choice mistakes too, check it again by some tools on the internet
Good luck with your ielts practicing time.
LadyOfClockwork 30 / 100  
Sep 17, 2020   #4
Hi, I'd love to rewrite a sentence for you:

"It is clear that ... time frame."
=> Fish was always dwarfed by any other food given in consumption throughout the period provided.

If you want to diversify your expression, my advice may be helpful.


Home / Writing Feedback / The graph gives data on the amount of fish, lamb, beef, chicken consumed over a period of 15 years
ⓘ Need Writing or Editing Help?
Fill out one of these forms for professional help:

Best Writing Service:
CustomPapers form ◳

Graduate Writing / Editing:
GraduateWriter form ◳

Excellence in Editing:
Rose Editing ◳

AI-Paper Rewriting:
Robot Rewrite ◳