Unanswered [5] | Urgent [0]
  

Home / Writing Feedback   % width   Posts: 5


IELTS - Graph people who are 65 and over in Japan, Sweden, American


AnnaWaston 1 / 2  
Aug 4, 2020   #1

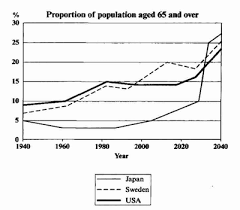
Proportion of population aged 65 and over


The graph illustrates the percentage of people who are 65 and over in Japan, Sweden, American from 1940 and predicts the future trend to 2040.
Overall, all three countries witnessed significant growth in the aging population over a century. Despite the general increasing trend, Japanese elderly people have the most noticeable fluctuation.

In 1940, the proportion of the population aged 65 and above of all three nations was lower 10%. For 60 years, there was a gradual increase in the figure for the USA and Sweden. Besides increasing, the number of people 65 and above of America remained slightly higher than those of Sweden, just about 5%. In contrast, the figure for Japan went down until the 1980s when it began to change direction.

The remainder of the period saw a significant change in the percentage of elderly people in all three countries. The number of older people in the US remained below 15% throughout two-decade before growing considerably to nearly 23% in 2040. During the same period, despite an increasing trend in both Japan and Sweden, a more dramatic rise is predicted between 2030 and 2040 in Japan.

  • tixung.png


Holt  Educational Consultant - / 15393  
Aug 4, 2020   #2
For the summary overview, you did a good job, but failed to indicate the measurement type as part of the summary. You should be indicating that the measurements were done in percentages so as to give clarity to the method of measurement presentation to the reader. Remember, the reader doesn't have a copy of this image so you need to give the reader as much information as possible for them to be able to create an imaginary image of the information you are presenting.

When you mention a gradual increase, mention what the measurement was for the increase. It will help to add to the conciseness of your presentation. As for Japan, what was the lowest point of measurement? You should indicate the data. You are writing a data report so you should not hold back on the data presentation. You need to know how to present assumptions of measurement or actual measurements that will help create a complete report for the reader.

Which 2 decades are you referring to in relation to America and the number of the elderly people? Listen, you need to understand that you cannot leave the reader guessing. This is a report, the reader doesn't have the time to guess, and they need to be properly informed. So use all the data you can find in the image to help with your report presentation. Otherwise, you leave your reader with more questions than answers about the image.
OP AnnaWaston 1 / 2  
Aug 4, 2020   #3
@Holt
Thank you so much!
Can you show me how to indicate the measurement type
Thank you
minhquan20 2 / 5  
Aug 5, 2020   #4
Hi, Here is my suggestion for you. I believe that your essay is lack of figures, which is a crucial part of this type of essay.

For example
... dramatic rise is predicted climbing from ... to .... between 2030 ...
kays 5 / 10  
Aug 6, 2020   #5
Hi, I would like to give some opinions for your essay.

Your essay is written well. Using fluctuation as the main idea is very nice, but you can make your essay sharper by adding the dominating country from the graph. For example you can highlight that USA has the most proportion from the 40's until the 90's and slightly before 2000. Also Sweden is predicted to have the most from the new millenium until early 20's, while Japan is estimated to have the most by 2040 (you already pointed Japan though).

Hope this helps :)


Home / Writing Feedback / IELTS - Graph people who are 65 and over in Japan, Sweden, American
Need Writing or Editing Help?
Fill out one of these forms:

Graduate Writing / Editing:
GraduateWriter form ◳

Best Essay Service:
CustomPapers form ◳

Excellence in Editing:
Rose Editing ◳

AI-Paper Rewriting:
Robot Rewrite ◳

Academic AI Writer:
Custom AI Writer ◳