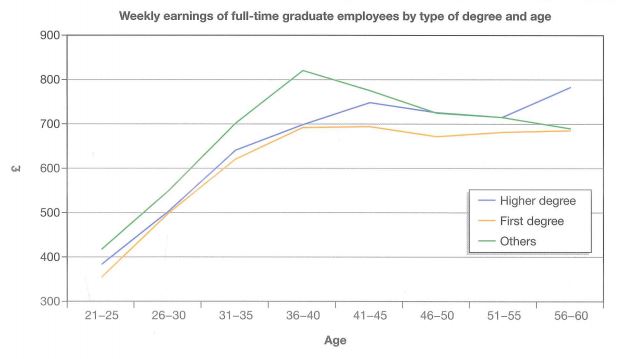
weekly earnings of full-time graduate employees
The graph shows the amount earned by graduates of different age groups in 2002. It includes those with a degree, those with a higher degree (postgraduate) and those with other qualifications. Summarize the information by selecting and reporting the main features, and make comparisons where relevant.
The given line graph described how much the graduates earned in 2002 from different age groups, and from those having different qualifications. Overall, we can clearly see that those people that were younger would earn more than the elder ones.
Firstly, with people having higher degree there was an upward trend, in which the number climbed dramatically, with those were from 21-35 years old. About the elder ones, from 35-45, the increase was slight, from between 600 and 700 to between 700 and 800. On the other hand, there was a marginal fall with people from 41-45 to 51-55, it dropped from between 700 and 800 to a little bit more than 700, whereas, with the oldest people, the amount of money grew up gradually to approximately 800. Secondly, there was a steady increase recorded with people from 21-40, and having low degree, then with the elder one, the money that they can earn stayed unchanged, between 700 and 800. Finally, with other ones, it was recorded that the younger people from 21-40 years old earned more, there was a dramatical upward trend, whilst with the people were 45 or older, the money they can made dropped steadily
To sum up, we see that all people with different ages and different qualifications would earn money high or low

linegraph1.jpg
