Unanswered [1]
  

Home / Writing Feedback   % width   Posts: 5


The graph shows average carbon dioxide emissions per person in the UK, Sweden, Italy and Portugal


nguyenle 1 / 2  
Jul 19, 2019   #1

ielts1 - line graph analysis


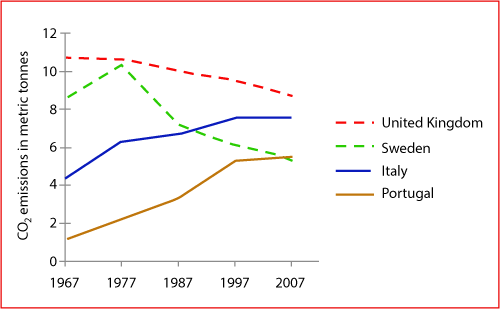
The graph below shows average carbon dioxide emissions per person in the UK, Sweden, Italy and Portugal between 1967 and 2007

The line graph gives information about how much carbon dioxide ( CO2 ) which each person emissions in four different countries over a period of 40 years. overall, there was a general decline in the production of co2 in UK and Sweden whereas the figure for Italy and Portugal increased steadily.

In the first years, 1967, the emission of co2 in Italy stood at 4.2, then it went u smoothly and reached a peak of 7.8 in 1977. likewise, the figures for Portugal was lower in the beginning of the year which just accounted for 1. next, there was an increase to 5 in the production of co2 and remained stable throughout the remainder of the period.

With regard to UK, in 1967, the emission of co2 was quite higher than that of other countries but after that, there was a gradual decline to nearly 8 at the end of a period. Although the two trends in UK and Sweden were similar in term of general decline, the production of co2 in Sweden varied more significantly than the figure for UK. It reached the highest point of over 10, then it decreased rapidly by over 6 in 2007, which is in the same level of Portugal.

  • Averagecarbondioxi.png


buihieu2705 1 / 1  
Jul 19, 2019   #2
In the first line, "which each person emissions" cant be used. You can use "each person emit" ( emission : noun)
Avoid using Next, After that . You can use "over the x following years or " In the next period" instead.
In the next-to last line " It reached....., then DECREASED ( "it" is omitted )
That's my opinion about ur essay. By the way, its still a good essay. Well done!
s410377088 11 / 22  
Jul 19, 2019   #3
the placement of your time adv. should be either at the front or at the end of the sentence

1. In the first years, 1967, the emission ...
2. Concerning the UK,, in 1967, the emission ... countries in 1967.
OP nguyenle 1 / 2  
Jul 24, 2019   #4
thanks a lot for your help
Maria - / 1096  
Jul 24, 2019   #5
@nguyenle
Hello there. I apologize for the delay. However, I'll still try to provide you with writing feedback in order to assist you fully in your learning endeavors.

First and foremost, try working on your overall structure and composition. Notice how some portions of your text are quite messy because of the lack of appropriate pauses and punctuation. To evade these issues, try to focus on simpler and yet more concise sentences before meshing them with larger bulks of text. If you can master this simplicity, you'll be able to go far.

In terms of content and organization, it would be beneficial for the readers if you are able to accommodate to deeper levels of analysis by making more thorough comparisons of graphs rather than sticking to blatant descriptions.

Best of luck as always.


Home / Writing Feedback / The graph shows average carbon dioxide emissions per person in the UK, Sweden, Italy and Portugal
ⓘ Need Writing or Editing Help?
Fill out one of these forms for professional help:

Best Writing Service:
CustomPapers form ◳

Graduate Writing / Editing:
GraduateWriter form ◳

Excellence in Editing:
Rose Editing ◳

AI-Paper Rewriting:
Robot Rewrite ◳