Unanswered [1] | Urgent [0]
  

Home / Writing Feedback   % width   Posts: 2


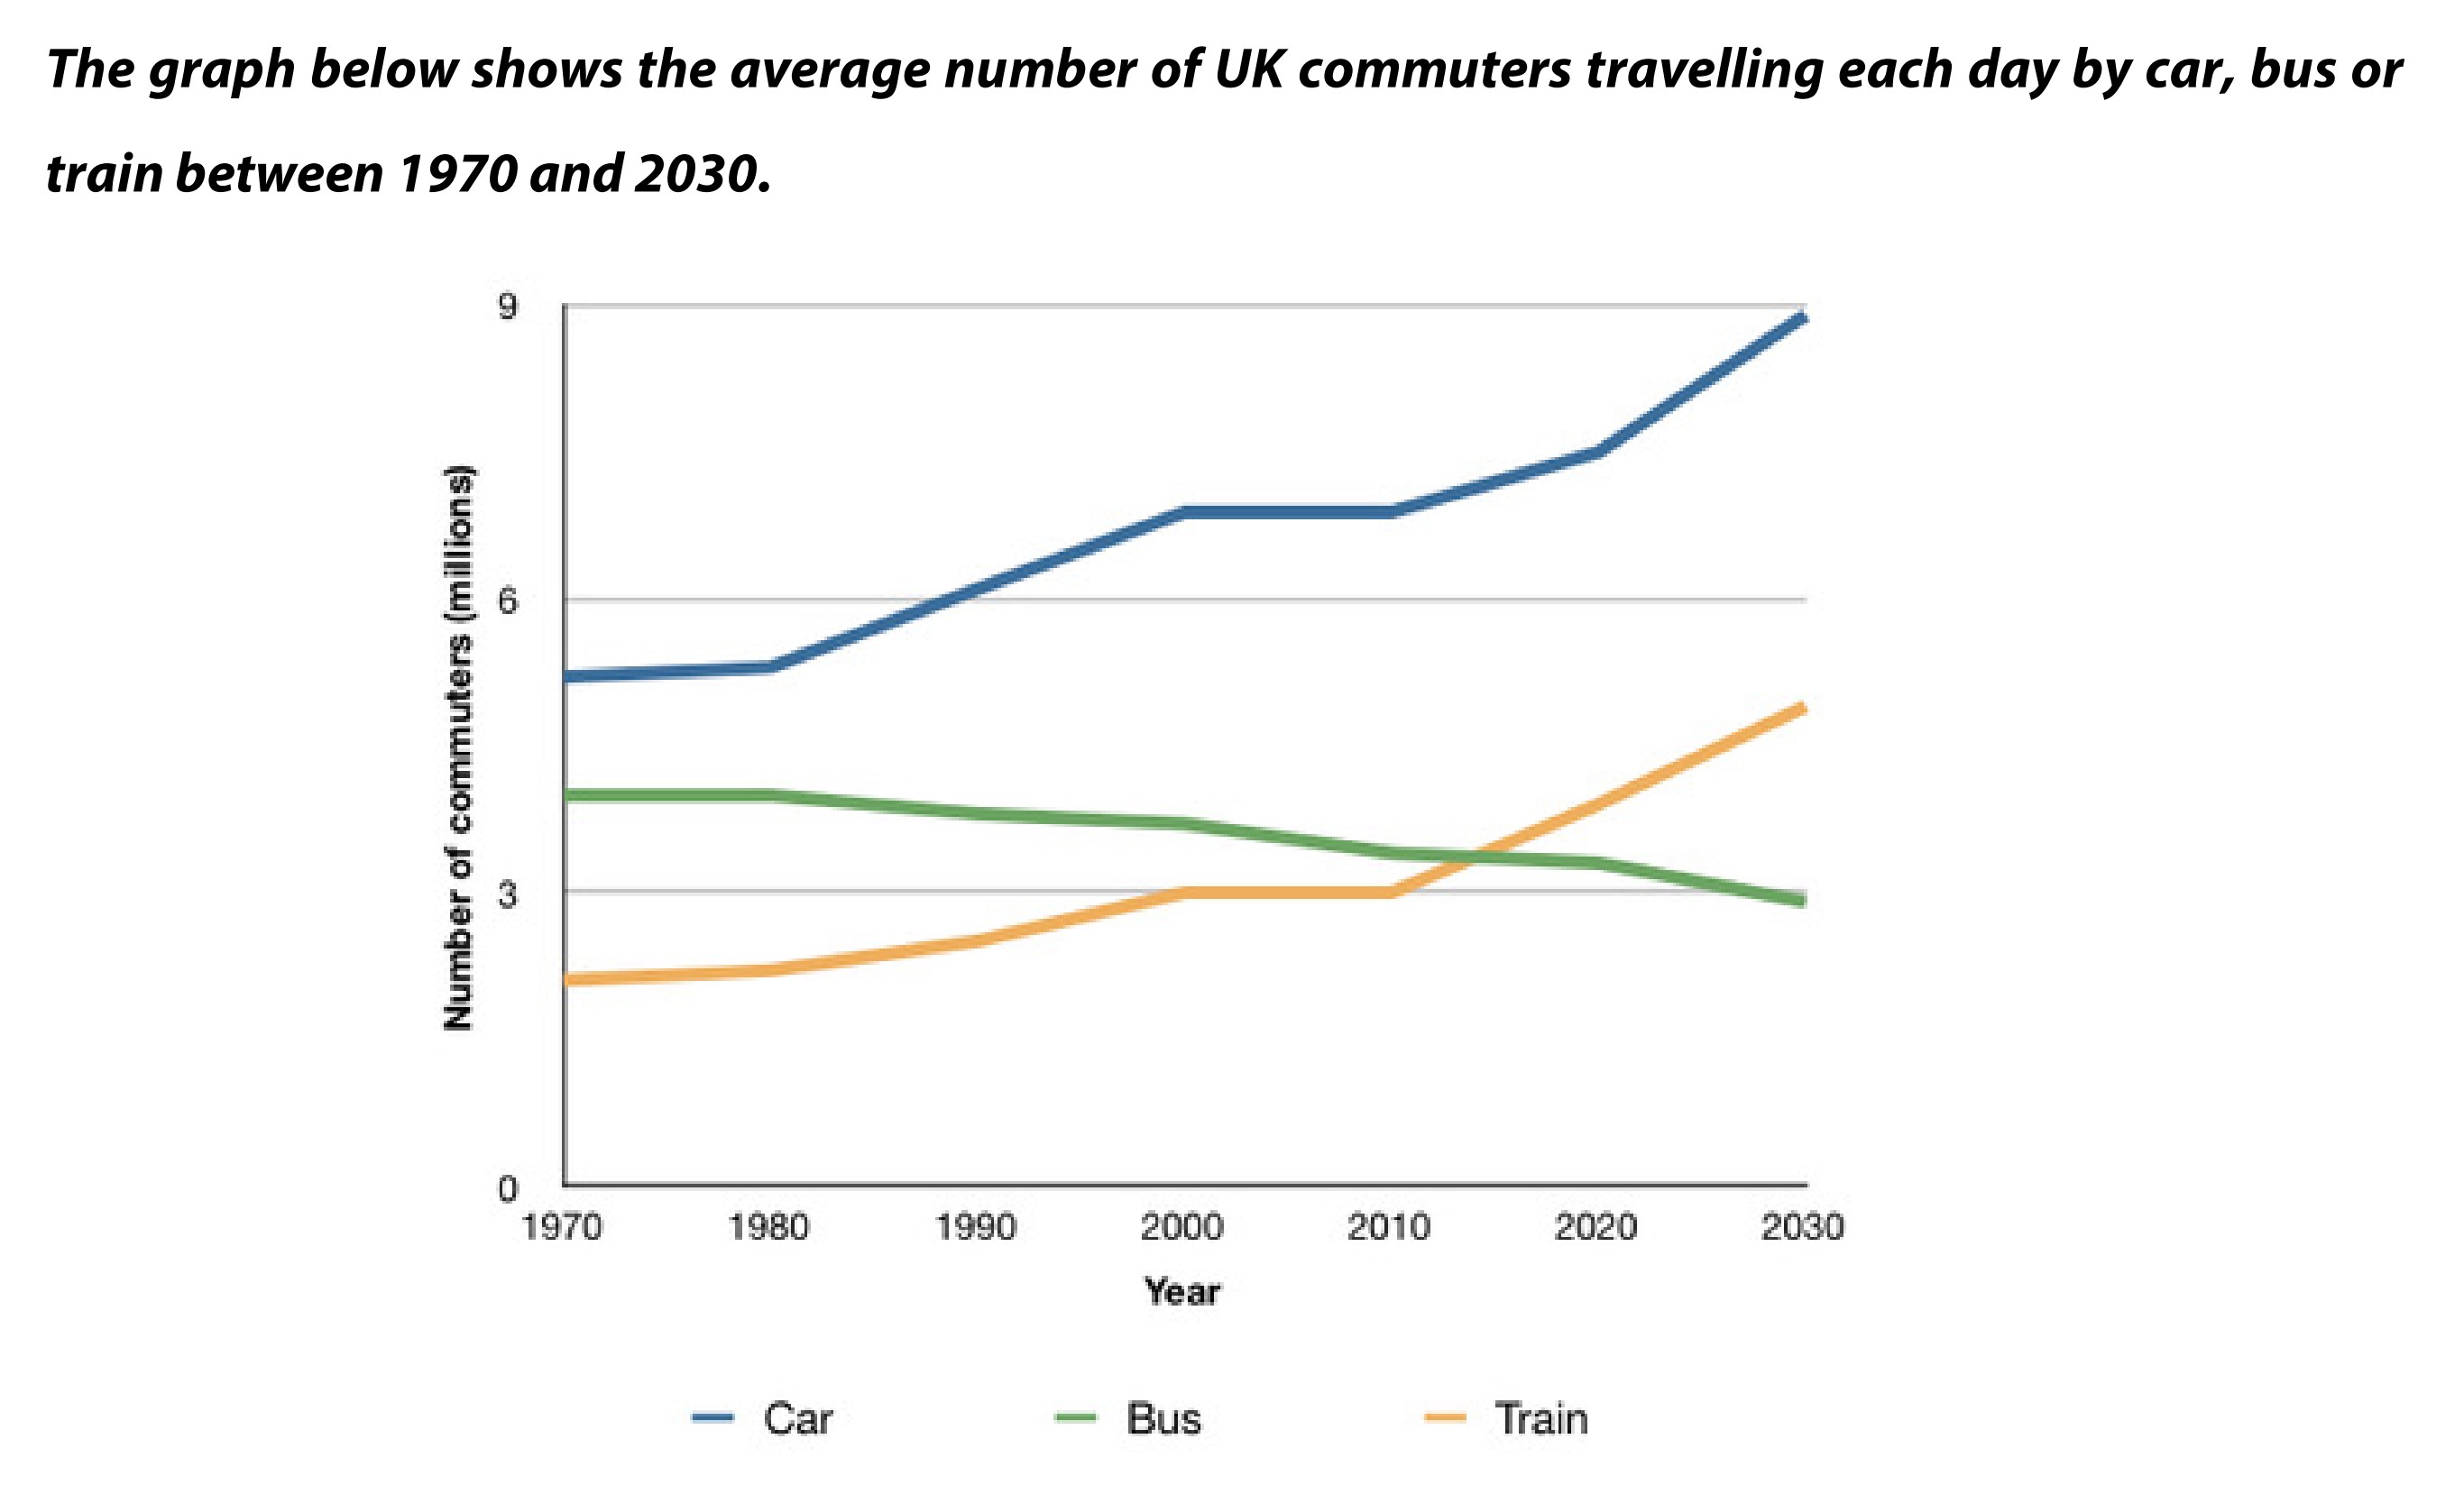
The graph below shows the average number of UK commuters travelling e train between 1970 and 2030


ptthao0801 3 / 4  
Jun 1, 2023   #1

The given graph gives information about daily traveling by vehicle in the UK from 1970 to 2030.


Overall, the numbers of car and train commuters increase gradually over the period shown, meanwhile, bus sees a decline in trend. Cars are seen as the most popular means of transportation.

In 1970, there were over 5 million people who drive in the UK, compared to 4 million people traveling by bus and 2 million rail passengers. The fall in the commute trend of buses and the uptrend in rail travel made an overlap in 2015, at around 3.5 million commuters. In the same year, cars reached over 7 million in the number of its users after a significant rise in 2000.

After 2015, growths in the trends of cars and trains continue and are expected to reach new peaks of 9 million and nearly 5 million, respectively, by the year 2030. In contrast, the number of bus users is predicted to drop to just under 3 million in the same year.

(171 words)

  • 2.jpg


Holt  Educational Consultant - / 15385  
Jun 2, 2023   #2
The summary overview is not only lacking in information, it is also rude and shows a lack of proper academic writing knowledge that will lead to a failing score in the GRA section. Never, not for any reason, write any portion of a task 1 or task 2 essay in all caps and bold. That is considered shouting at the examiner and of course, is so rude that you will get a failing score in the relevant sections. Aside from these main violations, you also wrote a run-on sentence that neglected to mention the type of measurements used in the graph. I realize that you may have seen other students writing their summary overviews in the same way. I have cautioned those students against the same practice for the same reasons I provided to you here. Stay within the sentence requirements per paragraph. Never write less than 3 sentences to meet the scoring requirements.


Home / Writing Feedback / The graph below shows the average number of UK commuters travelling e train between 1970 and 2030
Do You Need
Academic Writing
or Editing Help?
Fill out one of these forms:

Graduate Writing / Editing:
GraduateWriter form ◳

Best Essay Service:
CustomPapers form ◳

Excellence in Editing:
Rose Editing ◳

AI-Paper Rewriting:
Robot Rewrite ◳

Academic AI Writer:
Custom AI Writer ◳