summarise the information from the graph
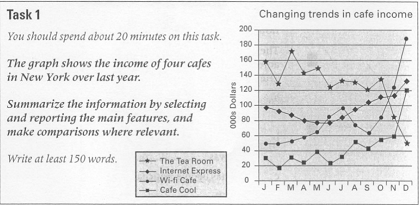
The graph illustrates the earnings of four types of café (the tea room, internet express, wi-fi café and café cool) in New York over the last year. Units are measured in thousands of dollars.
Overall, there were significant changes in the monthly income of all four cafes over the period given. While the tea room witnessed a considerable decrease, for the other three cafes, it rose.
In terms of the tea room, it was the most popular café in January with a monthly income of almost $160,000. In the following months, the figures experienced a wild fluctuation until October before dropping quickly to around $50,000 in December. Although the tea room earned the most money from January to October, its earnings became lower than the others in winter months.
By contrast, the income of the other three cafes went up by varying degrees. The earnings of cafe cool fluctuated between around $30,000 and nearly $60,000, followed by a sudden increase to $120,000 at the end of the year. Similarly, internet express had an upward trend. Its income fell steadily to just under $80,000 in June, after which it rose gradually ending the year at about $130,000. Likewise, in the first 7 months, the amount earned by wi-fi café doubled from around $50,000 to nearly $100,000 and then rocketed to approximately $190,000.

IELTSTASK11.PNG
