I'm preparing for IELTS and need help with my writing, any advice is appreciated. Thank you
Prompt:
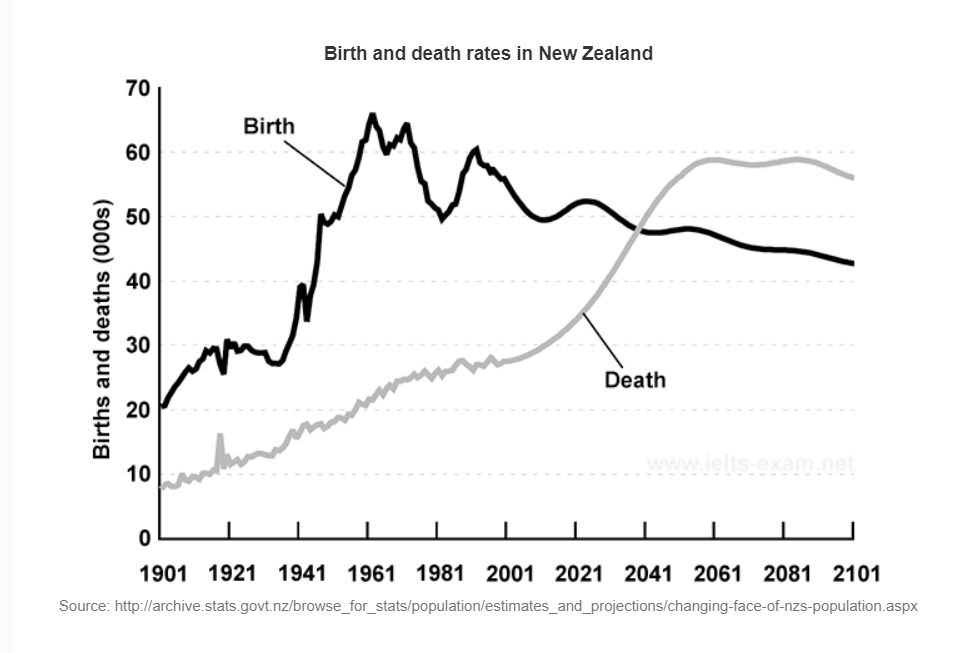
The graph below gives information about changes in the birth and death rates
in New Zealand between 1901 and 2101.
Summarise the information by selecting and reporting the main features, and make comparisons where relevant.
My essay:
The graph shows information regarding the birth and death rates in New Zealand from 1901 to present and gives prediction up until 2101.
Overall, according to the statistics, the birth rate peaked once around 1961 and would start to decrease overtime. On the contrary, death rate was anticipated to be on an increasing trend and only by 2061 would it stop rising.
The number of births, prior to 1941, were mostly under 40,000. In the next 20 years however, the birth rate exploded and peaked at around 65,000 newborns recorded in 1961. After that, the birth rate, as documented, though with little fluctuation, started to decrease and was predicted to remain on the declining trend until 2101.
As of the death rate, it was approximately 10,000 people in 1901 and steadily climbed to around 35,000 people in 2021. The rate is expected to keep increasing and will only stop in the year 2061, at around 60,000 people, and begin to even out.

the graph
