Unanswered [6] | Urgent [0]
  

Home / Writing Feedback   % width   Posts: 3


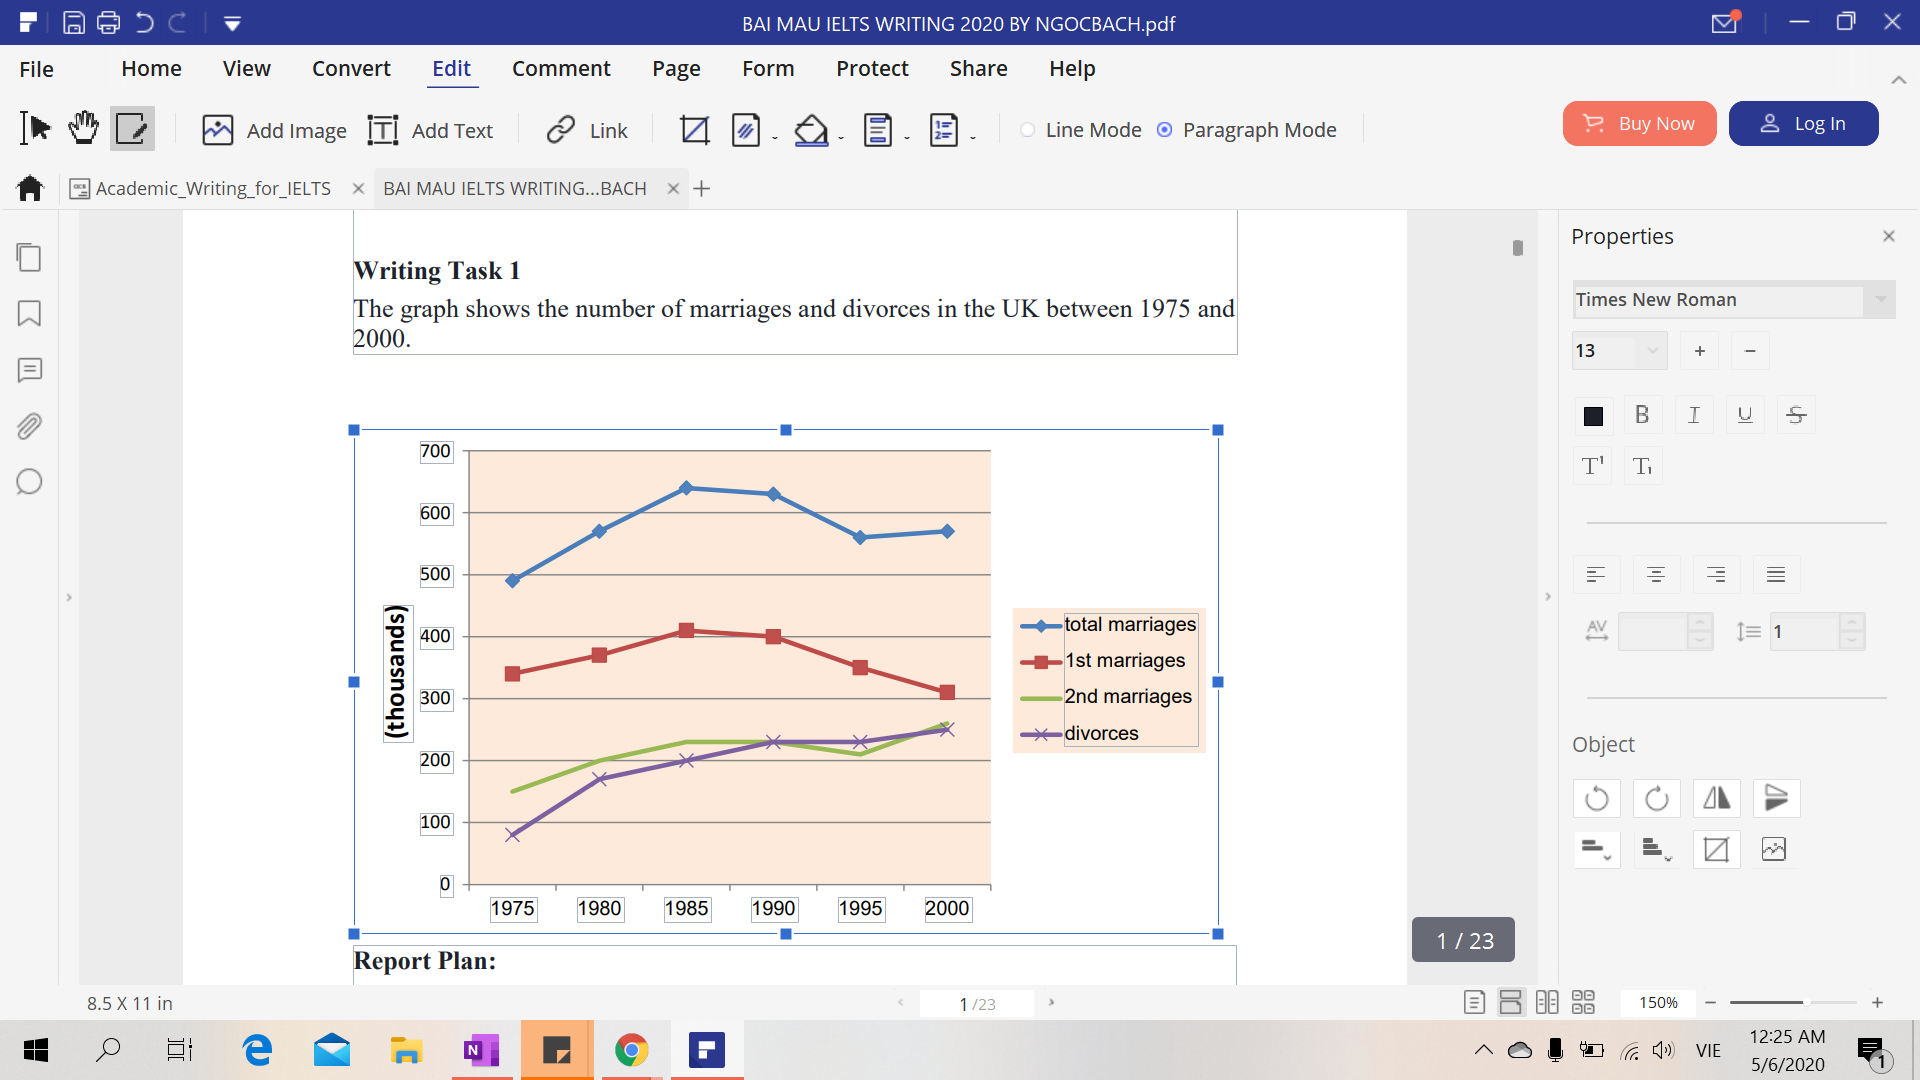
Writing task 1:The graph shows the number of marriages and divorces in the UK between 1975 and 2000.


hhoaianhh2905 2 / 2  
May 5, 2020   #1

Statistics of marriages and divorces


The line chart enumerates the proportion of marriages and divorces happening in the UK in the period of 25 years from 1975 to 2000.
As an overall trend, while the number of divorces slightly increased, the rate of the first marriages and total marriages experienced a decrease.
It is conspicuous that there was nearly 350 thousand marriages in 1975. Then this number went up progressively and reached the peak at about 400 thousand. However, after that, there was a dramatical reduction in marrages held in the UK from 1985 to 2000 ( by 100 thousand ).

When it comes to total marriages and 2nd marriges, it can be seen from the graph that the the number of both of them gradually fell slightly over the period of 5 years and then had a downward trend in 1995. Nonetheless, they both seemed to move upward again.

In contrast, there was a considerable growth in the proportion of divorces from 50 thousand in1975 to over 250 thousand in 2000 eventhough it was so much lower than three other categories, especially when compared to the first marriages.

  • please help me to correct it


RomanKoch 10 / 22  
May 6, 2020   #2
The line chart enumerates the proportion of marriages
It is in thousands not a percentage.
As an overall trend, while ...
You missed one line of data in your overall description.
I suppose it should be "350 thousand first marriages".
divorces from 50 thousand in1975 to ...
It is clear from the graph the number is not 50 thousand, more likely 75 thousand. But I have no idea whether examiners would mark this as a mistake.

eventhough it was so much lower than ...
This sentence is redundant, no new information presented.
Holt  Educational Consultant - / 15388  
May 6, 2020   #3
You have not been able to prove that you have done an original restatement of the discussion instructions from the original prompt. You retained too many of the original keywords in your presentation. You have to change the original presentation as best as you can. One way of delivering a different statement would have been:

The line graph highlights the 25 year trend of matrimony and annulment cases in the UK. The information was collected within 2 decades and half starting in 1975, ending in the year 2000. The numbers were collected in the value of thousands based on the total number of marriages, 1st marriages, 2nd marriages, and divorces. Overall, the trending graph showed that marriages were on the decline while divorces were on the upswing.

Try to avoid the use of parenthetical information. The use of parenthesis is not really advised in the academic presentations as it indicates an omitted, but required piece of information. You should be presenting the information within the paragraph requirements instead, as full sentences, to avoid any information confusion.

The minimum sentence requirement per paragraph is 3 sentences. This is to help you avoid the creation of run-on sentences. Your paragraphs are mostly long sentences, which will not be scored as complex sentences because of the error in information presentation. Do not confuse long sentences with complex sentences. These are not the same thing. Review your complex sentence creation lessons to help you avoid this common error in report writing.


Home / Writing Feedback / Writing task 1:The graph shows the number of marriages and divorces in the UK between 1975 and 2000.
Need Writing or Editing Help?
Fill out one of these forms:

Graduate Writing / Editing:
GraduateWriter form ◳

Best Essay Service:
CustomPapers form ◳

Excellence in Editing:
Rose Editing ◳

AI-Paper Rewriting:
Robot Rewrite ◳

Academic AI Writer:
Custom AI Writer ◳