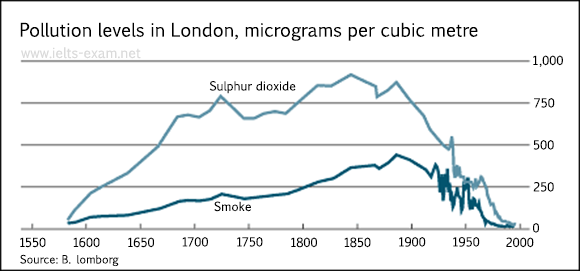
levels of sulphur dioxide and smoke in London over the centuries
The graph below shows the pollution levels in London between 1600 and 2000. Summarize the information by selecting and reporting the main features, and make comparisons where relevant.
The graph illustrates the pollution levels in London from 1600 to 2000. It measures the smoke and sulphur dioxide in micrograms per cubic metre. Overall, levels of the two pollutants share a similar pattern through the given period, while sulphur dioxide has a higher level of pollution than smoke in atmosphere.
In 1600, the pollution level was the lowest, however, it climbed in the next hundred year. Sulphur dioxide rose to around 700 micrograms, while smoke increased to an estimate of 200 micrograms. Over the next two hundred years, the levels of pollution grew consistently with a little fluctuation. The pollution level for sulphur dioxide peaked at nearly 900 micrograms in 1850. Smoke increased a little more steeply and peaked at about 450 micrograms in 1890. During the 20th century, both smoke and sulphur dioxide took a dramatic drop, although there was a fluctuation within the fall.
It is obvious that air pollution was considered as a bigger problem in the early 1900's than it is currently.(167 words)

IELTS_Writing_Task_1.png
