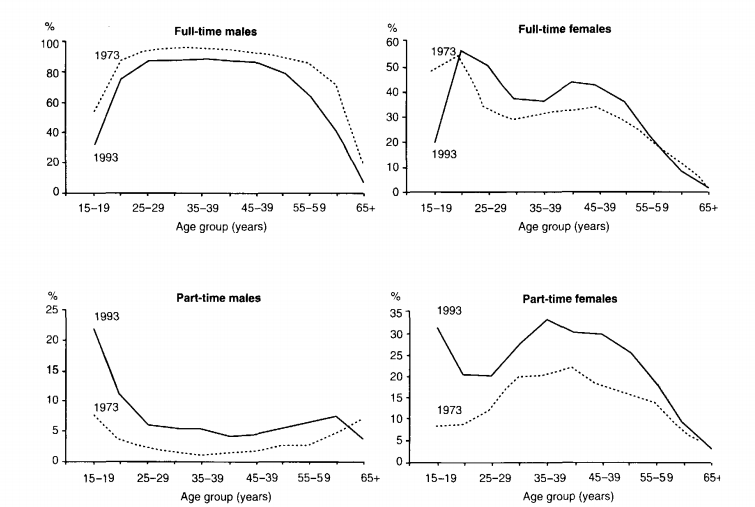
The graphs below show the number of men and women in full and part-time employment in Australia between 1973 and 1993.
The line graphs compare the percentages of males and females of different ages working full and part-time in Australia in 1973 and 1993. In general, the highest percentage of full-time employment was recorded among men in 1973, while females were busier in this type of employment in 1993. As for part-timers, this sector was more pronounced in 1993 for both genders and teenagers.
To begin with, around 80% to 90% of men between 25 and 59 were occupying stable jobs in 1973, but this figure was lower by 10% in 1993. Females, in contrast, peaked at 55% at around 20 years old, then went through a 15%-20% dip before peaking again in their forties. Besides, after the first peak, the graph shows more working women in 1993 by one-tenth.
While full-time employment of the youngest generation was the lowest, it was booming among underemployed, especially in 1993. The trend of males was the opposite to that of full-timers, with the peak of 22% and 8% for 1993 and 1973 among teenagers, respectively. Women, however, experienced two high points of a third of the part-time working population in their adolescence and thirties in 1993. Finally, in 1973, only a fifth of females aged 29 to 40 had flexible hours.

MALES.png
