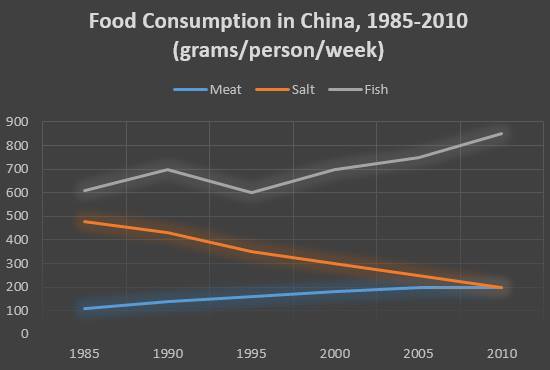
The line graph shows degrees of consumption in china between 1985 and 2010 (grams/person/week). Overall, consumption fluctuated. In 2010 there are increases consumtion fish and meat while consumtion salt dramatically decrease.
There were intresting phenomena showed by chart, In 2010 fish consumption dramatically increase approxiamtely 850 from 600 in 1995, while salt consumption decrease in 2010 around 200 and meat consumption improve 200 in 2010. Fish consumption was declined in 1995 from 700 to 600 but it was constant decrease next years. salt consumption constant declined years by years from 480 in 1985 to 200 in 2010, it was showed china's citizens did not like salt to being main consumption. Meat consumption double improves from 100 in 1985 to 200 in 2010 it was descibed people in china like meat to consumption. The lines diagram both fish salt and meat showed china's citizen disposed prefer fish than salt and meat.
There were intresting phenomena showed by chart, In 2010 fish consumption dramatically increase approxiamtely 850 from 600 in 1995, while salt consumption decrease in 2010 around 200 and meat consumption improve 200 in 2010. Fish consumption was declined in 1995 from 700 to 600 but it was constant decrease next years. salt consumption constant declined years by years from 480 in 1985 to 200 in 2010, it was showed china's citizens did not like salt to being main consumption. Meat consumption double improves from 100 in 1985 to 200 in 2010 it was descibed people in china like meat to consumption. The lines diagram both fish salt and meat showed china's citizen disposed prefer fish than salt and meat.

14355140_10205834051.jpg
