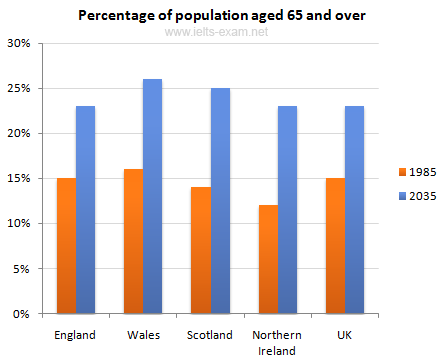
The chart shows the percentage of population aged 65 and over in 1985, and creates prediction for 2035. It compares figure for the UK's ageing during a half century.
Overall, the proportion of population for age 65 years and over which higher was Wales between 1985 and 2035. Beside that, the number of population with same age the lower was Nothern Ireland.
The figure for in 1985, England and UK has the same percentage around 15%. Futhermore, the aging people in Scotland still below England. Next, the proportion of Wales and Nothern Ireland were the highest and lowest almost 20 percent and 15 percent respectively. After 50 years later, the percentage of population aged 65 and over for England, UK, and Nothern Ireland is predicted approaching 25% and it is a significant increase from the previous year. In meantime, the proportion of population for Scotland will be in a quarter. Therefore, the figure for Wales the is forecast to be highest from 1985 to 2035.

IELTS_Writing_Task_1.png
