Unanswered [1] | Urgent [0]
  

Home / Writing Feedback   % width   Posts: 6


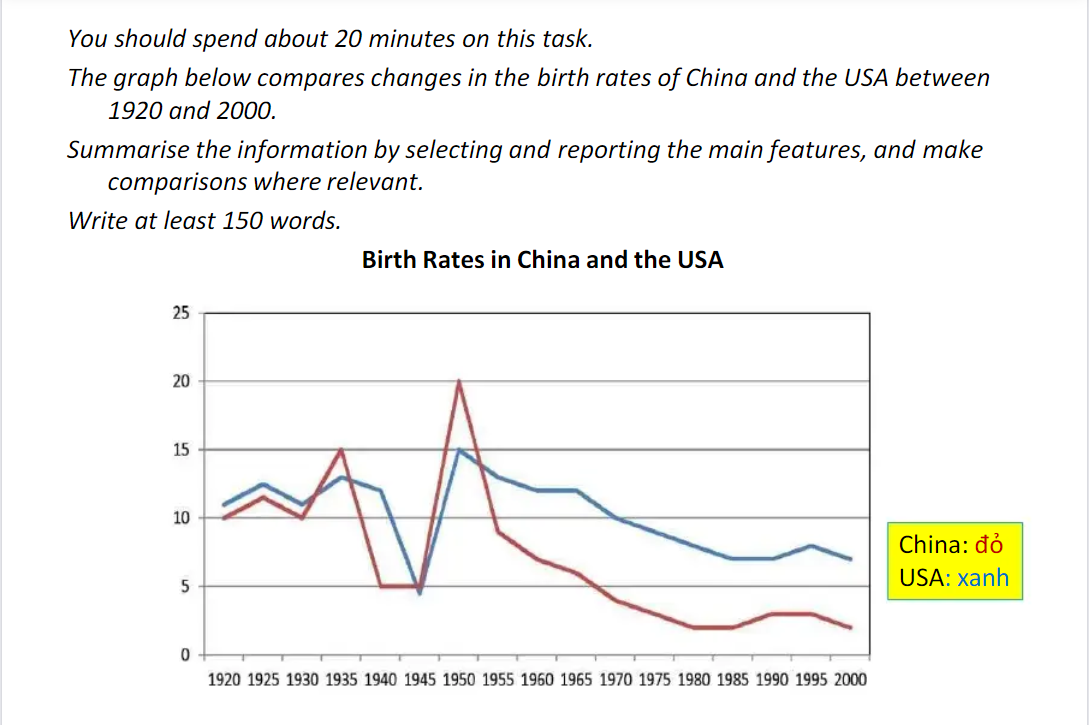
ielt task 1: the chart compare changes in the birth rate of China and US between 1920 and 2000


lhtp 1 / 3  
Aug 25, 2020   #1
The line graph shows the proportion of birth in China and The USA from 1920 to 2000.
As can be seen from the graph, China and the US experienced a global downward trend by varying degrees.
Despite of a slight increase of 5 percent between 1920 and 1935, the percentage of baby boom in the US recorded a sharp decrease by 10 percent in the next 5 years, before reaching a peak of 20 percent at 1950. The figure indicated that a rapid fall in rate of birth in The US from 20 to nearly 2 percent was observed from 1950 on-ward.

At the 5 year start, the ratio of giving birth in China stabilized around 13 percent, however, in the period 1935 to 1945 saw a plummet of babies to 5 percent. US and China had a similar pattern in the 5 years after which has characterized by rocket of 10 percent in the rate of birth, before a sharp drop to 6 percent was undergone after that.

A further point of interest that in 1950 both of US and China came top of the list, they as well as had downward trend in the final time.

  • task1trend..png


hangnguyenn 2 / 3  
Aug 25, 2020   #2
grammar mistake: despite not despite of
Holt  Educational Consultant - / 15385  
Aug 25, 2020   #3
Assume that the reader does not have a copy of the graph. Remember, you are writing a report for a professional. That means, you are not going to rely on the image being available for the reader. You need to be able to paint a better written picture for the reader than you did in the summary paraphrase. Expand on it a bit more. Look at the image again. Find some unique references that you can include in the overview that could make it more informative. The mental picture you create for the reader will be crucial to your TA score.

By the way, the term is "baby boomer" not "baby boom". You should not be using that reference in this report because the phrase connotes a person who reached adulthood during the 1980's. Since your essay goes well before and beyond that time frame, you should avoid using any terms that could be era specific in your report. It shows a lack of LR skills and understanding.

The second paragraph is improperly formatted and will affect your GRA score. The paragraph uses a limited number of punctuation marks and does not properly represent a mix of simple and complex sentences. You only present a series of run-on sentences and a preference for the use of commas. Limiting your ability to show that you know how to use other punctuation marks such as parenthesis, semi-colon, colon, percentage marks, etc.

Your final paragraph is composed of only 1 sentence. It feels out of place based on the way you created the sentence. As a part of a trending statement, it would have been better placed within the summary overview, thus allowing you to separate the first paragraph into 2 equally important paragraphs, creating the more standard easily understood, and better developed discussion presentation comprised of the 3 paragraph format for your essay.
Phamthihaiha 2 / 3  
Aug 25, 2020   #4
despite (not despite of)
an article is missing before "baby boom", "rate", "rocket", "US", "downward trend"
in 1950 (not "at 1950")
You should write at least 3 sentences in one paragraph.
OP lhtp 1 / 3  
Aug 25, 2020   #5
@Holt
Thank you so much. Your feedback is so useful for me.
HolanLovesMath 1 / 2  
Aug 29, 2020   #6
Your final paragraph should have more than 1 sentence.


Home / Writing Feedback / ielt task 1: the chart compare changes in the birth rate of China and US between 1920 and 2000
Need Writing
or Editing Help?
Fill out one of these forms:

Graduate Writing / Editing:
GraduateWriter form ◳

Best Essay Service:
CustomPapers form ◳

Excellence in Editing:
Rose Editing ◳

AI-Paper Rewriting:
Robot Rewrite ◳

Academic AI Writer:
Custom AI Writer ◳