Im studying IELTS. This is the first time i write essay. I hope any member this site can correct and review my article
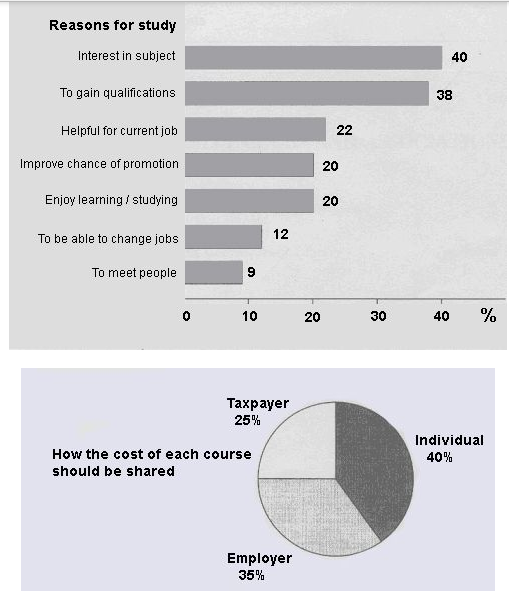
The charts below show the results of a survey of adult education. The first chart shows the reasons why adults decide to study. The pie chart shows how people think the costs of adult education should be shared. Write a report for a university lecturer, describing the information below.
Write at least 150 words, and spend 20 minutes.
My essay:
The bar chart gives information about the percentage of purposes adult education. The pie chart illustrates the opinions of various people about how tuition fees show be divided among society's member. Seen together, the results of surveys suggest a link between the reasons and studying cost for further education.
The reasons for taking education in adulthood are aggregated into three groups that have similar percentage. The largest proportion group includes interesting in subject and gaining qualifications as reasons account for approximately 40 %. The second group contains 3 reasons. Some people think that, continuous learning will be helpful for their job account for 22 %, others, slightly lower at 20% feel it will help them improve opportunities for their promotion, and remain people in this group are learning because of their enjoy study with 20 percent of total reasons. The third group make up a small minority percent, roughly 10%, they want to learn due to make new friends and change new jobs.
The pie chart indicates that 40 % people think that they will pay for their study by themselves. Other respondents at 35% show that employer should foot the bill for them. A small minority of people (25%) want government help theme by taxpayer service.

Capture.PNG
