This is my analysis for an IELTS Writing Task 1. Please give it some comments (eg. logic, grammar, vocab, etc.). Thank you so much!
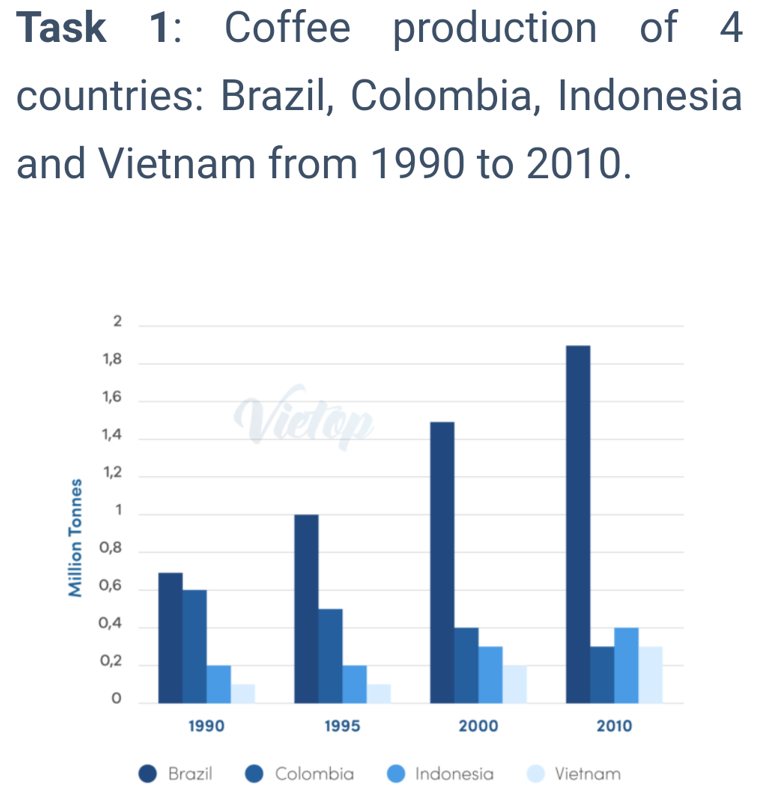
The bar chart given provides information on coffee production in Brazil, Colombia, Indonesia, and Vietnam commencing from 1990 to 2000.
Over the timeframe, the amount of coffee produced by Colombia fell while the other countries experienced the opposite pattern of the production. In 2000, there were marked discrepancies in the statistics.
The coffee production of Colombia began at 0.6 million tonnes in 1990 and decreased significantly in the next ten years to under 0.4 million tonnes in the last year. This was noticeably inconsistent with the corresponding figure for that of Brazil which registered a dramatic rise from below 0.8 million tonnes to over 1.8 million tonnes, respectively. Besides, both Asian countries saw a rather marginal increase over the period.
Around 1.9 million tonnes of coffee products were manufactured by Brazil in 2010, accounting for the largest contribution to the market. This was followed by Indonesia, whose production mass was by 1.5 million tonnes lower. Otherwise, Vietnam and Colombia shared the bottom position of the graph in the year by producing equally around 0.3 million tonnes of the products.
IELTS Task 1 - Coffee Production
The bar chart given provides information on coffee production in Brazil, Colombia, Indonesia, and Vietnam commencing from 1990 to 2000.
Over the timeframe, the amount of coffee produced by Colombia fell while the other countries experienced the opposite pattern of the production. In 2000, there were marked discrepancies in the statistics.
The coffee production of Colombia began at 0.6 million tonnes in 1990 and decreased significantly in the next ten years to under 0.4 million tonnes in the last year. This was noticeably inconsistent with the corresponding figure for that of Brazil which registered a dramatic rise from below 0.8 million tonnes to over 1.8 million tonnes, respectively. Besides, both Asian countries saw a rather marginal increase over the period.
Around 1.9 million tonnes of coffee products were manufactured by Brazil in 2010, accounting for the largest contribution to the market. This was followed by Indonesia, whose production mass was by 1.5 million tonnes lower. Otherwise, Vietnam and Colombia shared the bottom position of the graph in the year by producing equally around 0.3 million tonnes of the products.

Question
