Hi everyone, since Im a newcomers in IELTS, kindly check my task and feel free give a suggestions and criticism.
Thanks in advance.
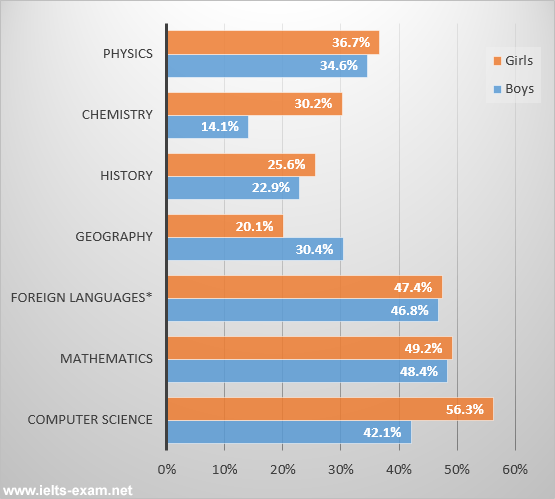
The bar chart below shows the percentage of students who passed their high school competency exams, by subject and gender, during the period 2010-2011.
Summarise the information by selecting and reporting the main features, and make comparisons where relevant.
The represented chart illustrates information about the number of students who succeed on their high school test in 2010/2011 and is measured by subject. It is noticeable that Computer Science had the highest rate of success by hit around 100% combined between girls and boys, whilst History experienced approximately half of it in total for both sexes.
At the beginning, the subjects like Computer Science, Mathematics, and Foreign Languages including French, German, and Spanish had the highest rate of success among all. Despite the boys who stood around at 40%, the girl students nearly hit 60% rate for Computer Science. At the same time, Mathematics and Foreign Languages had a similar rate by almost hit 50%, for both gender.
On the other side, the rest subjects had a moderate rate of success. Physics sit around 35%, whereas Chemistry marked a significant difference between girls and boys, by 30,2% and 14,1%, respectively. Geography, however, experienced a similar rate with Chemistry, but 10% higher for boys, and History had the lowest rate among all.

IELTS_Writing_Task_1.png
