Thanks for your assessment in advance. Can you focus on my word choice, task achievement, grammar, coherence and cohesion?
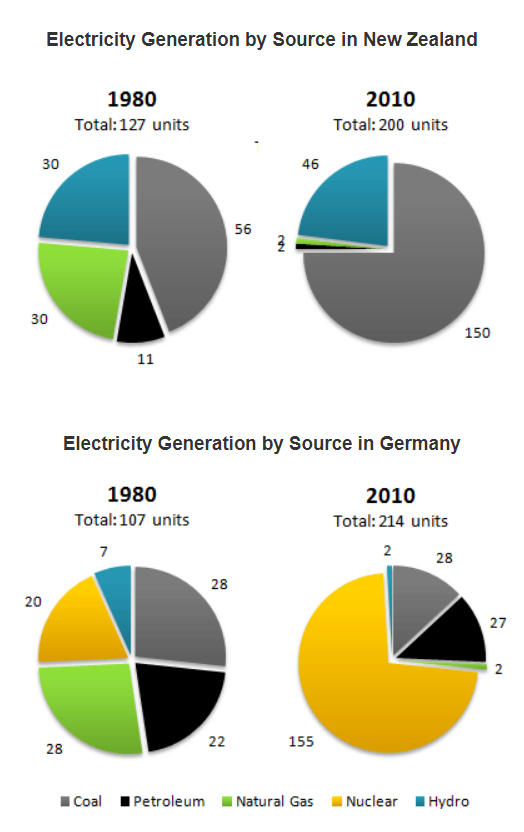
The pie charts below show electricity generation by source in New Zealand and Germany in 1980 and 2010.
MY ESSAY
The chart reveals information regarding the proportion of energy generated from five sources in New Zealand and Germany in 1980 and 2010. Generally, both countries experienced a marked increase in the total energy units and the most electricity was produced by coal in New Zealand and by nuclear in Germany.
To commence, in New Zealand, the units of coal, reaching 56 units, exceeded those of the others in 1980. Meanwhile, figures of natural gas and hydro amounted to an identical number of 30 units, while that of petroleum was at its minimum of 11 units. In 2010, there was an upsurge in the electricity proportion of coal, accounting for three fourths of the total energy in New Zealand. In contrast, those of natural gas and petroleum dropped moderately to resembling 2 units, and the opposite pattern was seen in hydro. In Germany, during 1980, both natural gas and coal generated a similar highest number of 28 units, as opposed to that of hydro. It was subsequently followed by petroleum and nuclear, with 22 and 20 units respectively. Over 2010, Germany underwent a great boom to 155 units, when hydro and natural gas both fell into a trough of 2 units. In the meantime, that of petroleum was almost as large as of coal.
IELTS TASK 1: ELECTRICITY GENERATION
The pie charts below show electricity generation by source in New Zealand and Germany in 1980 and 2010.
MY ESSAY
The chart reveals information regarding the proportion of energy generated from five sources in New Zealand and Germany in 1980 and 2010. Generally, both countries experienced a marked increase in the total energy units and the most electricity was produced by coal in New Zealand and by nuclear in Germany.
To commence, in New Zealand, the units of coal, reaching 56 units, exceeded those of the others in 1980. Meanwhile, figures of natural gas and hydro amounted to an identical number of 30 units, while that of petroleum was at its minimum of 11 units. In 2010, there was an upsurge in the electricity proportion of coal, accounting for three fourths of the total energy in New Zealand. In contrast, those of natural gas and petroleum dropped moderately to resembling 2 units, and the opposite pattern was seen in hydro. In Germany, during 1980, both natural gas and coal generated a similar highest number of 28 units, as opposed to that of hydro. It was subsequently followed by petroleum and nuclear, with 22 and 20 units respectively. Over 2010, Germany underwent a great boom to 155 units, when hydro and natural gas both fell into a trough of 2 units. In the meantime, that of petroleum was almost as large as of coal.

dddddddddddd.PNG
