Hi there, I'm preparing for the IELTS exam. I will be very appreciated if you help me check this essay for IELTS writing task 1
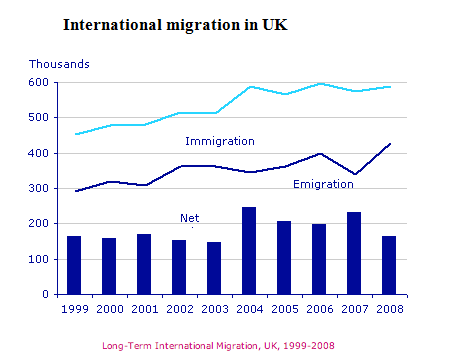
The chart illustrates information about immigration, emigration and net immigration throughout the nine-year period from 1999.
In the first five years, the number of residents immigrated in and emigrated out of Britain were both slightly fluctuated in an almost resemble manner, but the figures for immigration were significantly higher. Numbering at 450,000 or so in 1999, immigration rate climbed to just more than 500,000 in 2003. Similarly, emigration rate, which stood at up to 300,000 in the starting year, increased by practically 50,000 in 2003. As a result, net immigration rate remained fairly constant at some 170,000 in this period
In the following years, net immigration showed an erratic behavior. It suddenly peaked at somewhere in the region of 250,000 in 2004. The explanation for this case is that in 2004, the number of people who came to live in UK accelerated to more or less 600,000 while roughly 350,000 people moving out. The rest of this period saw a similar pattern to the first five years.
As can be seen from the chart, immigration and emigration rate both increased but in slightly different manners.
(185 words)

simon_1.3.png
