Unanswered [1] | Urgent [0]
  

Home / Writing Feedback   % width   Posts: 9


IELTS Writing task 1: Internet Users from countries as percentage of population 1999-2009


maizaq 1 / -  
Mar 30, 2020   #1

the proportion of Internet usage in three nations


Please help me assess my ability. Here are my essay: ^-^ thanks

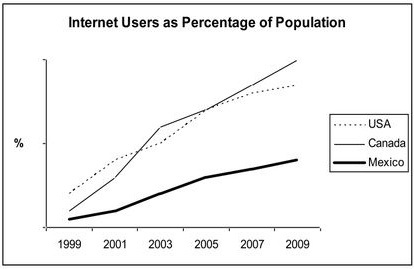
The line graph give comparisons of the proportion of Internet usage in three nations between 1999 and 2009.
Overall, the percentage of three coutries' population using Internet witnessed an upward trend over the period of 10 years. However, there is a more significant rise in the proportion of American and Candian users compared to Mexicans ones.

In 1999, the amount of USA's citizens using Internet stood at the first position at about 20%, while the figures for Canadians and Mexicans were lower, at 5% and 10% respectively. The year 2005 remarked the similarity in the percentage of Internet users at approximately 70% in two countries USA and Canada. More Mexicans, at the same year 2005, used Internet than last 5 years, accouting for 25% of population. By 2009, almost 100% of Canadians using Internet, positing the highest. The number of users in USA was about 80%, which is 40% higher than that of Mexico.

  • iw.jpg


Holt  Educational Consultant - / 15384  
Mar 30, 2020   #2
Try to write at least 175 words for the Task 1 essay. That is the word count that will ensure the possibility of a high ending score for your data analysis. You have to make sure that you write 3 paragraphs as well since this is a task 1 essay. Your format is a bit off. It is feels mechanical. There is no real analysis of the data. You are just taking the information straight out of the page and writing about it in the test booklet.

You are not trying to figure out the deeper meaning of the data nor offer an analysis of the data in comparison to the year on year results. There are certain points in the line graph where the data touches one another in the presentation. Those are comparison points that were not represented in your essay. The instruction for this type of image is always inclusive of "make comparisons where relevant". You did everything except that in your presentation.

You show a potential to do a proper analytical essay. The problem is that you did not really apply an analysis to the data. That is also why your presentation is so short. Try to lengthen it up to 190 words so that you can get the full scoring potential of your work. By scoring potential, I mean:

- You have the ability to analyze the information
- You understand how the data relates to one another
- You can represent the importance of the information via the trending statement

Your presentation is creative, with room for more creativity in the presentation. Remember though, do not be over creative in the presentation. Keep the analytical academic tone intact at all times.

Spelling problems:

coutries' = countries
Candian = Canadian
accouting = accounting

Brush up on your subject verb rules (the line graph give = the line graph gives). Good job on using estimation words in the essay. Since no actual percentage measurements were given, you were right to connote the information with a sense of uncertainty. This represents an approximation in this instance.

Good attempt at task 1 writing. I look forward to seeing your upcoming improvements.
Thangnguyen315 8 / 24  
Apr 2, 2020   #3
i think your writing has some mistakes in terms of grammar and the word choice. For instance, the first sentence of the overview paragraph, it would be better to write the period witnessed changes rather that to write the percentage witnessed changes. And I saw also the verb tense problem, like ' this is a more significant rise", which is actually should be in simple past tense.

That is my opinion!
SUONYIL LAM 2 / 6  
Apr 4, 2020   #4
Your essay presents the important information. However, you has some problem about spelling and grammar. Just a little, don't worrry and carefully
HunT 2 / 2  
Apr 4, 2020   #5
I think you should got 4 paragraphs ^^
nabilah_hannan 4 / 8  
Apr 8, 2020   #6
I think you should do analyze the line graph more then please make it into 3 paragraphs, for the body 1, you can write about Canadian and American and. Next, in the body 2, write about Mexican
Froggy23 1 / 3  
Apr 8, 2020   #7
Try to make at least 3 paragraph. In this you can make paragraph for each country and also increase your word count.
Lam Trann 1 / 3  
Apr 11, 2020   #8
the line graph gives
The USA
Canadian
I guess y should have more paragraphs then
And the year witnessed not the % witness ( cz I have never seen this case so that y should choose safe ways)
clara2608 2 / 3  
Apr 14, 2020   #9
I think you should got 4 paragraphs with 2 bodies.
The first one you can describe and compare USA and Canada
The second one you analyse Mexico because it has separate data compared to other countries.


Home / Writing Feedback / IELTS Writing task 1: Internet Users from countries as percentage of population 1999-2009
Do You Need
Academic Writing
or Editing Help?
Fill out one of these forms:

Graduate Writing / Editing:
GraduateWriter form ◳

Best Essay Service:
CustomPapers form ◳

Excellence in Editing:
Rose Editing ◳

AI-Paper Rewriting:
Robot Rewrite ◳

Academic AI Writer:
Custom AI Writer ◳