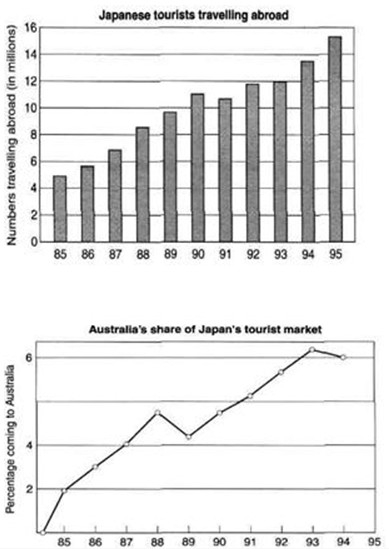
The graphs describe the amount of Japanese travel abroad in the period of 1985 to 1995 and the percentage of Australia account for Japanese tourist market in these ten years.
As we can see from the first bar chart the figure of Japanese tourists travel abroad shows clearly upward trend, started at 5 millions in 1985 then peaking at 15 million in 1995 with steadily rose.
It shows a similar pattern in the second graph, which can see that the percentage of Japanese traveled to Australia from 0% in 1985 shoot up to about 4.7% in 1988.In following years, It reached the highest point at 6.2% in 1993 after declined to around 4.1% in 1989. After that ,having slightly decreasing until end of 6% in 1994.
To sum up, there are not only remarkable improvement in Japanese oversea tourism but also promote Australia's share of Japan's tourist market during 1985 to 1995.

321.jpg
