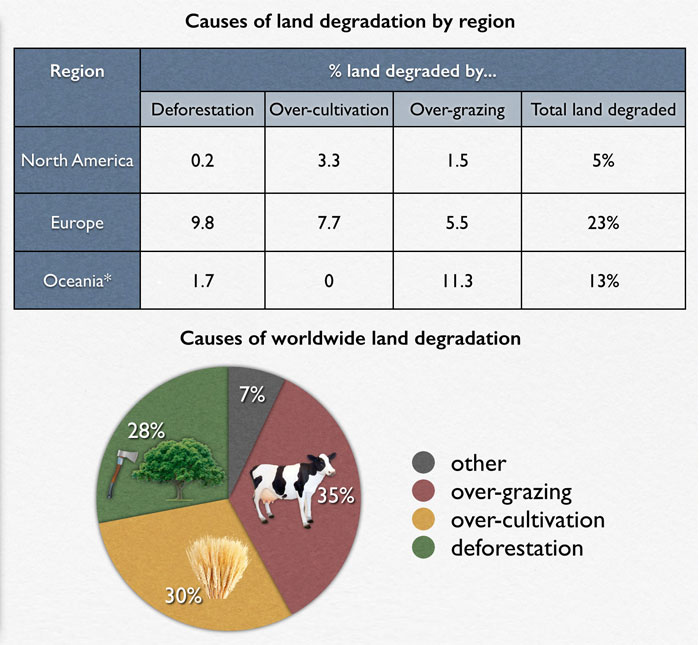
The pie chat below shows the main reasons why agricultural land becomes less productive. The table shows how these causes affected three regions of the world during 1990s. Summarise the information by selecting and reporting the main features, and make comparisons relevant.
The pie chart provides an information about the main caused by unproductive farmland. Closerly look, the table another explanation based on their region. Overall, raising animals in the openland caused the highest number of degradation and the region who did it the most is Europe.
Based on the data, there are three major factor which divided the chart more than one per quarter. The highest percentage among the others was using land for animals in wide area so they can easily eat grass. The second factor was illegal lodging about 30 percent . However, other factor got the smallest percentage in under ten percent.
Dividing area of how the land degradated, the table put three regions. With the total farmland lost, Europe ranked the first position with 23 percent and still became number one for cutting the tress from the forest and over cultivation. The shocking result came from Oceania which this region had zero percent cultivation although the last position of degradation land was secured by North America.

land_degradatioon.jp.jpg
