Unanswered [0]
  

Home / Writing Feedback   % width   Posts: 3


Language students - IELTS WRITING TASK 1 - TWO PIE CHARTS COMPARISON


roswita116 16 / 37  
Nov 4, 2019   #1

proportion of uk students able to speak a foreign language


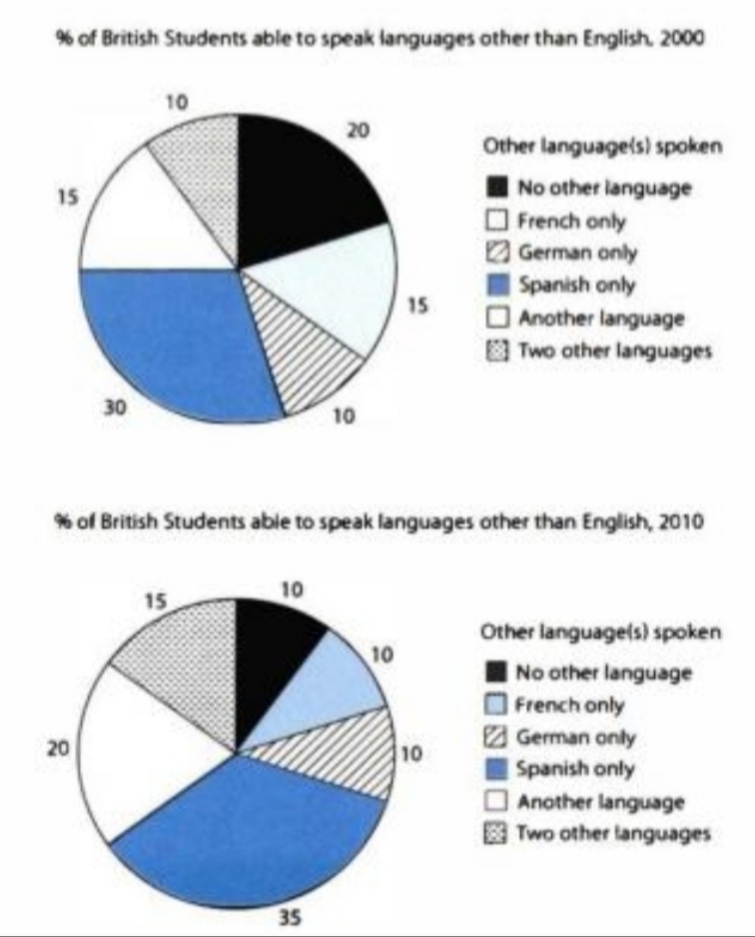
The charts below show the proportions of British students at one university in England who were able to speak other languages in addition to English, in 2000 and 2010.

Summarise the information by selecting and reporting the main features, and make comparisons where relevant.


The two pie charts illustrated the percentage of students who were utilized languages beside English at an university in England in the years of 2000 and 2010,respectively.

Overall, it is crystal clear to see that Spanish accounted for the majority portions of both years while students who are fluent at German stood at the least percentage.

Having an exact figure, it is exceedingly obvious that students who can speak Spanish not only occupied almost half portions of pie charts in both years but also increased 5% from 2000 to 2010.

While the percentage of students who were able to speak Spanish rose, the proportions of students who have no other language abilities decreased slightly from 20% to 10%. Similarly, the percentage of students who were able to speak French shared the same trend which decreased from 15% to 10%.

Furthermore, other languages spoken by students such as German remained steady which was 10% in both pie charts.

  • 20191104_192326.jpg


Bear Lac Loi - / 3  
Nov 5, 2019   #2
Hello roswita116. If I may, I would like to provide some comments and an example for your essay.

Your essay is good. However, you are being unfair to other languages by emphasizing non-proportionally on Spanish while cramping the rest in only a couple sentences.

The objective of your writing should be as required: selecting and reporting the main features and make comparisons where relevant. You should take a minute or two to study the charts and pick out the obvious.

To me, I noticed the following:
1.Number of students who know only English decreases to half (20% to 10%)
2.Number of students studying another language increases up to 33% (French, Spanish, and any other)
3.Most students favor Spanish (35%). French stands second (20%) but rises faster
4.Number of students who learn a third language increases 50% (10% to 15%)

You can start your essay by rephrasing the topic, such as:

"Both charts show the percentage of British students who were able to speak other languages in addition to English in 2000 and 2010."

Hope this helps.
OP roswita116 16 / 37  
Nov 7, 2019   #3
@Bear Lac Loi
Thank you for your detail suggestion. I really appreciated. 😁😁
As I read through your feedback. Some of advice is really helpful;however, some of them expecially the writing structure I would like to remain the same. Here I would like to indicate again that for the IELTS writing task 1, we must write down the "overall " part without any number or percentage in the 2nd paragraph instead of conclusion which is adverse from your writing suggestion. 😁

And for the first paragraph, you should paraphrase the topic instead of using the same vocabulary and same grammar structure.
Furthermore, I am kind of confused about that the last part of your feedback."the number of students who can speak two other languages increased dramatically at 50%" ?!?!?! Referring from the pie chart, I cannot see any 50% growth from what you mentioned about.

All in all, thank you for your kind help.😁😁


Home / Writing Feedback / Language students - IELTS WRITING TASK 1 - TWO PIE CHARTS COMPARISON
ⓘ Need Writing or Editing Help?
Fill out one of these forms for professional help:

Best Writing Service:
CustomPapers form ◳

Graduate Writing / Editing:
GraduateWriter form ◳

Excellence in Editing:
Rose Editing ◳

AI-Paper Rewriting:
Robot Rewrite ◳