The following is my writing for task 1. Thanks in advance for your comment and advice.
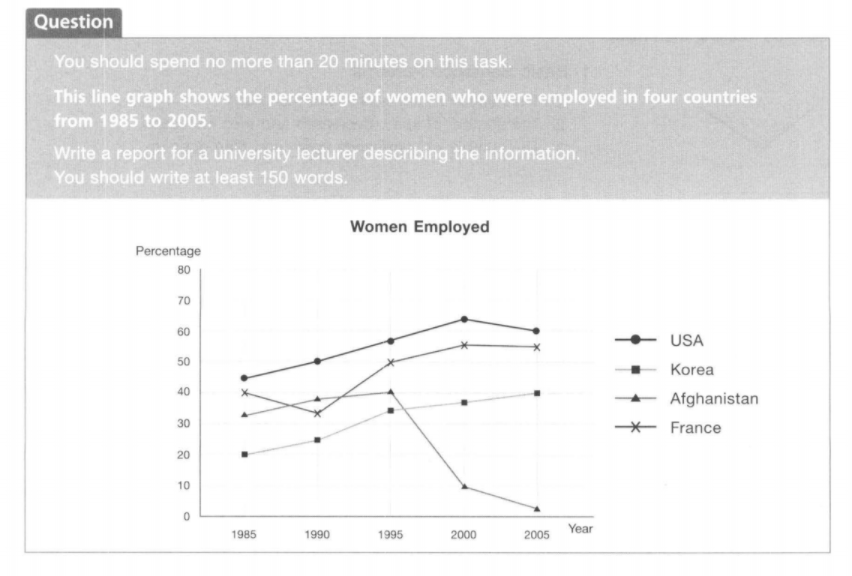
This chart shows the percentage of women employed in four countries over an interval of twenty years. Information is shown for the USA, Korea, Afghanistan, and France from 1985 to 2005.
As can be seen from the chart, the rate of employed women in the USA went up steadily from 1985 to 2000. There was a slight decrease in the last five years. In Korea, there was a steady twenty-year increase with no fall in the percentage of women employed. For ten years from 1985 to 1995, Afghanistan's percentage of employed women rose slowly. However, there was a sharp drop of 30% between 1995 and 2000. This went down further in 2005. France's rate of employed women fell by 10% in the first five years of the period. The rate then increased continuously until 2005.
In conclusion, all countries had a higher percentage of employed women in 2005 than in 1985 except for Afghanistan. Out of four countries, the USA and France were the countries where the majority of women were employed in 2005
write a report describing the information
This chart shows the percentage of women employed in four countries over an interval of twenty years. Information is shown for the USA, Korea, Afghanistan, and France from 1985 to 2005.
As can be seen from the chart, the rate of employed women in the USA went up steadily from 1985 to 2000. There was a slight decrease in the last five years. In Korea, there was a steady twenty-year increase with no fall in the percentage of women employed. For ten years from 1985 to 1995, Afghanistan's percentage of employed women rose slowly. However, there was a sharp drop of 30% between 1995 and 2000. This went down further in 2005. France's rate of employed women fell by 10% in the first five years of the period. The rate then increased continuously until 2005.
In conclusion, all countries had a higher percentage of employed women in 2005 than in 1985 except for Afghanistan. Out of four countries, the USA and France were the countries where the majority of women were employed in 2005

Screenshot122.png
