Unanswered [0]
  

Home / Writing Feedback   % width   Posts: 4


Writing task 1 line graph - The changes in the rates of birth and death in New Zealand from 1901


zang 1 / -  
Nov 30, 2021   #1

Writing task 1 line graph.

This is my first time, can you give me some comments?

Hello everyone. This is the first time I finished a writing task, so I am posting it here to find some feedback. Thank you for reading. 🙆‍♀️

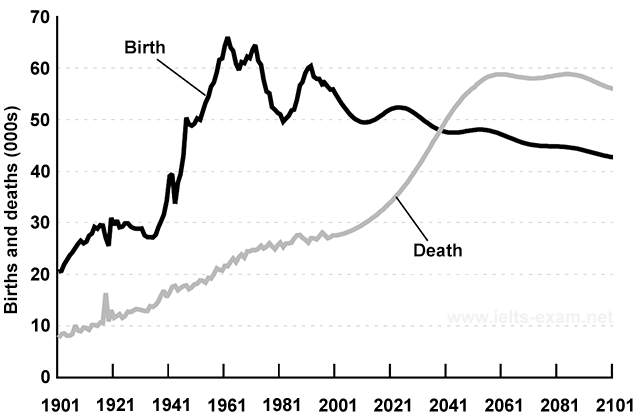
The line graph illustrates the changes in the rates of birth and death in New Zealand from 1901 and gives the forecast trends until 2101.

Overall, both birth and death rates have increased, but the number of deaths has been more steadily rising.

For 40 years, from 1901, the birth rate fluctuated from 20000 to 30000. Then it was pumped up to the highest point in 1961. After that, the rate of birth started to decline slowly, to about 45,000 by the end of the period.

Compared with the birth rate, the number of deaths from 1901 to recently was lower. However, after a steady increase in progress, the rate of death will be overlooked in 1941 and reach its peak in 2061. Since that time, the number of deaths has stopped augmenting and maintained a level of about 60,000.
Holt  Educational Consultant - / 15466  
Nov 30, 2021   #2
Please avoid posting exterior links in your messages. You could have easily cut and paste the question into your thread but you did not do so. Instead, you violated forum rules:

- Do not post exterior links which are considered direct advertising for other websites at our forum
- Do not post exterior links that may contain malware and other security threat potentials for our forum users

You were given a second chance by the moderators of this forum which is why you will be receiving advice from me.

The essay will receive an automatic failing TA score because you wrote less than the required 150 word minimum. This will result in points deductions based on word count. This will applied prior to the sectional scoring considerations. Such deductions could result in an overall failing score.

pumped up

Avoid the use of English slang words. Stick to academic writing references for proper tone and analysis presentation.

Try to use a uniform sentence presentation in the reporting paragraphs. These should be uniform at 3-5 sentences each so that you will easily assure yourself of meeting the word count.
nhidinh1231 4 / 7  
Nov 30, 2021   #3
I have just searched and found some information about your prompt. Hope that the next time I could see the depicted picture and the given prompt of your essay.

The line graph illustrates... It is good of you to paraphrase the given prompt and clearly provide for people what kind of the map was.

but the number of deaths has ...
I think that it would be more obvious if you mentioned both of the trends, instead of one of them.

..., the birth rate fluctuated from ... I do not think that "fluctuated" was a good choice. In my opinion, it should be "increased". Then it was pumped up to the highest point in 1961 clearly demonstrate what the number of the highest point was.

After that, the rate of birth ...
It should be "started decline in 1981, and is expected to gradually decline until it was 45000 by the end of the period"


  • IELTS_Writing_Task_1.png
tdl 1 / 3  
Dec 2, 2021   #4
hello , i think you have a good introduction because you paraphased some words like shows,... i think you should provide more adv to describe like considerably, sharly, dramatically.


Home / Writing Feedback / Writing task 1 line graph - The changes in the rates of birth and death in New Zealand from 1901
ⓘ Need Writing or Editing Help?
Fill out one of these forms for professional help:

Best Writing Service:
CustomPapers form ◳

Graduate Writing / Editing:
GraduateWriter form ◳

Excellence in Editing:
Rose Editing ◳

AI-Paper Rewriting:
Robot Rewrite ◳