Unanswered [7] | Urgent [0]
  

Home / Writing Feedback   % width   Posts: 2


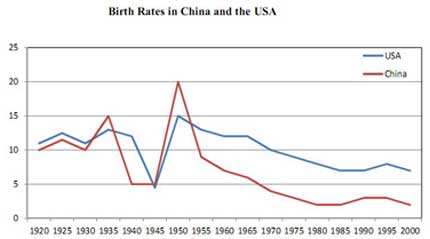
The line graph compares the proportions of fertility in China and USA from 1920 to 2000


thutra14101 1 / -  
Apr 24, 2020   #1

changes in the birth rates of China and The USA


The line graph compares the proportions of fertility in China and The USA from 1920 to 2000.
It's clear that this research period witnessed significant fluctuations in the birth rates of both China and The USA, with lows during the 1940s and highs during the 1950s.

In the year 1920, the percentage of the birth in China was exactly 10%, while the figure for The USA was slightly higher, at over 10%. The period from the first year to 1935 experienced moderate increases in China and The USA, making up for around 15% and 13% respectively.

There were noticeable oscillations over the following 15 years. The proportion in fertility in The USA hit the bottom in 1945, at about 5% before reaching a peak of 15% after 5 years later. Meanwhile, the birth rate in China also touched the lowest point, at about 5% in 1940 and remained stable for 5 years. Between the next year and 2000, the percentage of the birth declined in two countries, with a plummet for China and a gradual drop for The USA.

  • ieltsreportbirthr.jpg


Holt  Educational Consultant - / 15388  
Apr 24, 2020   #2
The reporting is good enough to possibly warrant a passing score. There are few errors in spelling and grammar that need to be addressed along with some referencing improvements that need to be pointed out.

You do not need to capitalize the word "the" in reference to the USA. Only USA needs to be capitalized because that is the proper noun in the reference. It is the actual name of the country.

When referencing the measurements, do not use the same numerical reference in a single sentence. When you say that China's birthrate was exactly 10% and the USA was over 10 percent, you create a redundancy in the presentation. Offer instead an estimate of the measurement. You could have said "the USA birthrate was estimated at possibly 12 percent" instead. Offering an estimate shows an analysis of the information instead of the simplistic repeating of data, where it might be inappropriate.

Vary your word references. You don't have to keep saying the individual names of the countries. You could say "both countries", "individual nations", "per country", or other variations. Work on improving your LR score through the use of synonyms.

Oscillations is a complex word, but not applicable in the reference of the essay. You are trying to impress the reviewer by using advanced vocabulary where you can. Even though it does not feel right, nor does it properly apply to the context you are writing. Do not use big words if you are not use of the applicability of the definition. The report still needs to sound like it was written by an ordinary person, not a scientist. Using everyday words, in the proper way, will get you a better LR score than using complicated words out of context.


Home / Writing Feedback / The line graph compares the proportions of fertility in China and USA from 1920 to 2000
Need Writing or Editing Help?
Fill out one of these forms:

Graduate Writing / Editing:
GraduateWriter form ◳

Best Essay Service:
CustomPapers form ◳

Excellence in Editing:
Rose Editing ◳

AI-Paper Rewriting:
Robot Rewrite ◳

Academic AI Writer:
Custom AI Writer ◳