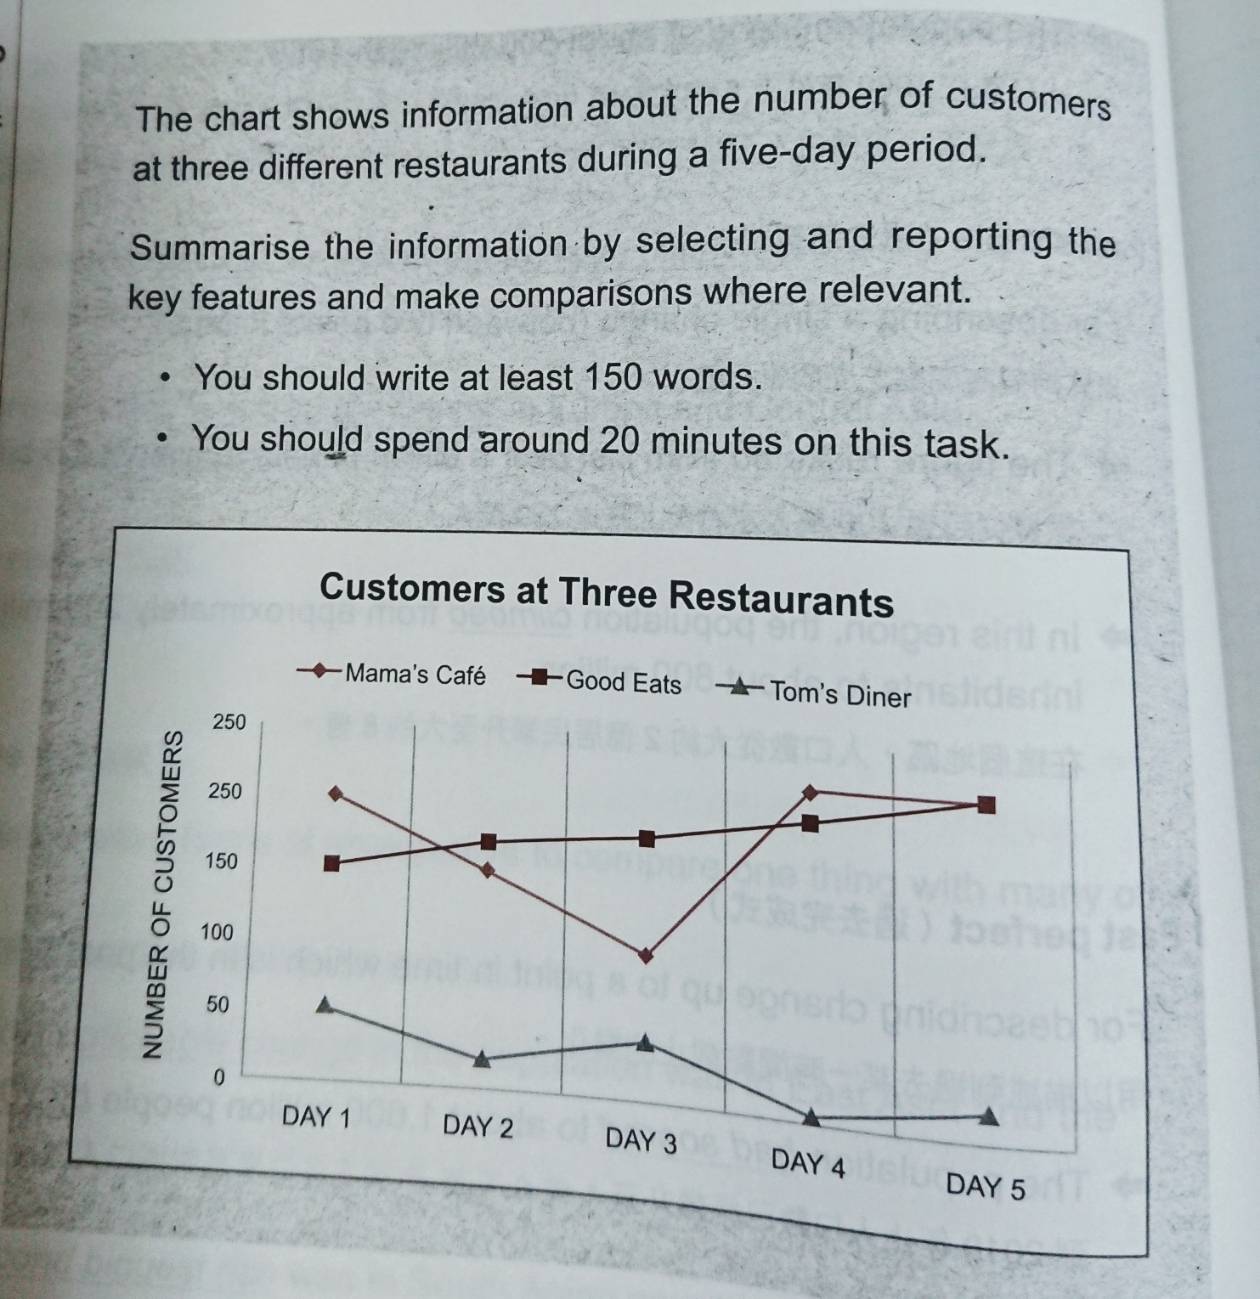
Question: The chart shows information about the number of customers at three different restaurants during a five-day period
The line graph illustrate the changes in the number of customers over five days, at three restaurants, namely Mama's cafe, Good Eats and Tom's Diner.
Overall, Tom's Diner had the lowest number of guests in the period. We also can see that Mama's cafe and Good Eats had higher customers in comparison with Tom's Diner.
On the first day, Mama's Cafe had the most diners. Whereas, the figure plummet dramatically on second day and it was dropped around a hundred by Day 3. Subsequently, customer numbers rocketed noticeably on forth day and leveled off on Day 5. In contrast, Good Eats had a stable rise in the number of guests. The figure was about 150 on the first day and climbed to 230 on Day 5. Finally, Tom's Diner had approximately 50 customers on Day 1 and almost 0 on Day 4. There was a slight increase around 20 customers on the final day.
Customer Numbers Comparison
The line graph illustrate the changes in the number of customers over five days, at three restaurants, namely Mama's cafe, Good Eats and Tom's Diner.
Overall, Tom's Diner had the lowest number of guests in the period. We also can see that Mama's cafe and Good Eats had higher customers in comparison with Tom's Diner.
On the first day, Mama's Cafe had the most diners. Whereas, the figure plummet dramatically on second day and it was dropped around a hundred by Day 3. Subsequently, customer numbers rocketed noticeably on forth day and leveled off on Day 5. In contrast, Good Eats had a stable rise in the number of guests. The figure was about 150 on the first day and climbed to 230 on Day 5. Finally, Tom's Diner had approximately 50 customers on Day 1 and almost 0 on Day 4. There was a slight increase around 20 customers on the final day.

task_1_line_graph.jp.jpg
