Unanswered [2] | Urgent [0]
  

Home / Writing Feedback   % width   Posts: 3


The line graph illustrates how many crime-related incidents occurred in the inner Newport city


DuongYen 1 / -  
Jul 12, 2018   #1

The changing rates of crime in the inner city from 2003 to 2012


The line graph illustrates how many crime-related incidents is occurred in the inner Newport city over the course of 10 years starting in 2003. 3 categories of crime, namely burglary, car theft and robbery.

Looking at the chart, it is immediately obvious that, from 2003 to 2012, the amount of robbery and car theft cases experience a remain relatively unchanged trends, with the exception of a downward trend in burglary rate.

The robbery was not a popular crime in Newport city center during the period of 2003 to 2012, due to the number was fluctuated between 500 to 1000 cases in those years. With the same movement, the rate of car theft crimes was recorded in keeping to change under 3000 and hit a low at 2000 incidents in 2006.

The number of burglary incidents saw a decreasing by more than 2 times in the 10-year period from 2003. The crime stood at nearly 3500 burglary cases in 2003 before reached a peak at around 3750 cases in 1 year later.
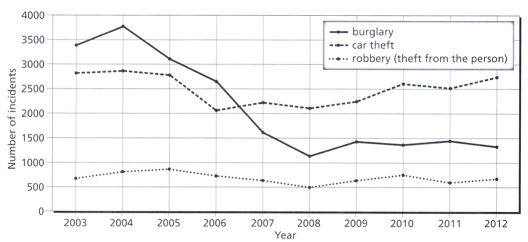

  • The chart below shows the changes that took place in three different areas of crime in Newport City


Holt  Educational Consultant - / 15344  
Jul 12, 2018   #2
Doung, you are not fully utilizing the given information in the line chart. Your essay is composed solely of run-on sentences that do not have an actual analysis of the information you were presented with. You did not follow the appropriate format for writing a Task 1 analytical essay. Your information presentation is going to be pulled down in terms of TA, GRA, and C&C considerations because you are writing without pause. Thus making the information difficult to understand, analyze, and remember for the reader perusing your summarized report. It does not come across as a true analysis of the information because you are only repeating the same information without doing any true comparison analysis in the essay.

It is not enough to say that a portion went up and a portion went down. Compare all 3 crimes based on periodical information, cross comparisons, and similarity points. Not just on the obvious. The main instruction for these essays is always "makes comparisons when relevant" and in this instance, the comparison points where the 2 of the 3 crimes intersect should have been reflected as well.

A critical eye is required in order to get a good Task 1 score. That means, you need to find the less obvious information and report upon it. That report boosts your score because the examiner knows that you actually took the time to study the image, rather than rushing to write what you can because you were watching the clock.

Therefore, this essay has the following problems that you should improve upon next time:

1. A lack of proper paragraph representation of 3-5 sentences. Avoid run-on and long sentences that combine all the information using commas to connect independent topic ideas.

2. There are 3 trending statements that should be summarized into one in this essay as per the crime rate presentation. Robbery had a steady upward trend, burglary was downward, and car theft fluctuated regularly over the given time period. These should have been summarized into one trending sentence as part of the summary overview. Your trending representation was inaccurate and flawed in this instance because you did not really bother to study the actual trend for each. There was no rate of crime that was left relatively unchanged over the given time period.

3. A deeper analysis of comparison points. After stating the obvious sections in the presentation, go back and review the chart one more time for presentations you might have missed during the outlining and drafting process. Add the information then review, revise, and edit the content before submission.
jsmith0513 1 / 2  
Jul 13, 2018   #3
@DuongYen
The chart is a nice way to explain your research, but I do not completely understand what you are trying to prove. You have many run on sentences in your essay. Each paragraph should have at least 3 sentences. I would suggest using a sentence outline to help you organize your thoughts that way your essay flows easier and other that read your essay has a better understanding of what you are trying to inform others of.


Home / Writing Feedback / The line graph illustrates how many crime-related incidents occurred in the inner Newport city
Do You Need
Academic Writing
or Editing Help?
Need professional help with your assignments? Fill out one of these forms:

Graduate Writing / Editing:
GraduateWriter form ◳

Best Essay Service:
CustomPapers form ◳

Excellence in Editing:
Rose Editing ◳

AI-Paper Rewriting:
Robot Rewrite ◳