Unanswered [1] | Urgent [0]
  

Home / Writing Feedback   % width   Posts: 3


[ IELTS ] The line graph illustrates the number of cars that were owned by households in Britain


skinnypeter 3 / 6  
Aug 4, 2021   #1

CAR OWNERSHIP IN BRITAIN


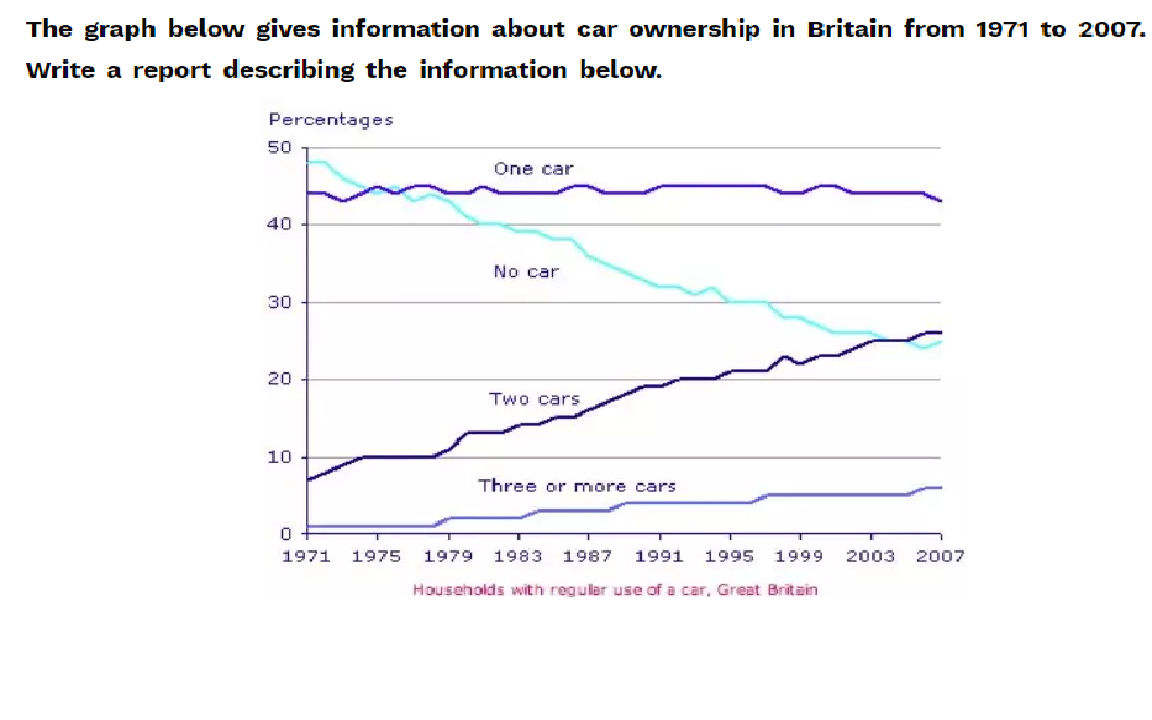
The line graph illustrates the number of cars that were owned by households in Britain between 1971 to 2007.

Overall, it is clear that car ownership increased during the period shown, while the number of households without a car fell dramatically.

In 1971, 49% of Britain households did not have a regular use of a car, and the percentage of households with a car was about 45%. It was uncommon for families having more three cars and two cars, by around 2% and 8% of households respectively.

The proportion of households that used two cars rose significantly to around 26% in 2007, while the statistic for families without a car experienced
a dramatic decline to 25% in 2003 before reaching the dip at 23% in 2006 ,and then growing again to 25% in 2007. In contrast, The percentage of households with a car remained stable from 1971 to 2007, and the proportion of households with more three cars increased slightly from 2% in 1971 to 8% in 2007.

  • carownership.png


Holt  Educational Consultant - / 15344  
Aug 5, 2021   #2
The writer has a tendency to use ven on sentences for his presentations. Though this makes it easier to complete sentence presentations, it affects the clarity of information as presented in the paragraphs. A clear sentence is one that focus on individual data delivery per sentence. Compressing the information confuses the sentence focus and paragraph discussion targets.

It is important that the writer makes better use of transition words to achieve this. There are no transition words or phrases used in the presentation which means the GRA score is compromised. While the presentation works to a certain degree, the writer can still do more the improve his score.
OP skinnypeter 3 / 6  
Aug 8, 2021   #3
@Holt
thank you for your advice.


Home / Writing Feedback / [ IELTS ] The line graph illustrates the number of cars that were owned by households in Britain
Do You Need
Academic Writing
or Editing Help?
Need professional help with your assignments? Fill out one of these forms:

Graduate Writing / Editing:
GraduateWriter form ◳

Best Essay Service:
CustomPapers form ◳

Excellence in Editing:
Rose Editing ◳

AI-Paper Rewriting:
Robot Rewrite ◳