Unanswered [1]
  

Home / Writing Feedback   % width   Posts: 2


The line graph illustrates the number of people aged 65 and more - over 100 years period


nhuquinhh 1 / -  
May 16, 2020   #1

iELTS WRITING TASK 1 ACADEMIC - LINE GRAPH


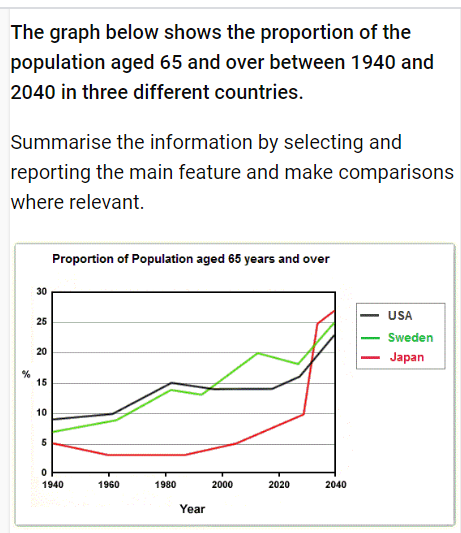
The line graph illustrates the number of people living in three different countries (USA, Sweden and Japan) aged 65 and more than over 100 years from 1940 to 2040. Units are measured in percentage.

Overall, the percentage of the population aged 65 and over increase over the period given. At the start of the period, American accounted for the highest proportion among three countries, while Japan is predicted that it will replace the United States in 2040.

Between 1940 and 2020, USA and Sweden experienced an oscillation in the percentage of people aged 65 and over. In 1940, around 10% of people in America aged 65 and over compared to about 8% in Sweden. While as, the number of Japanese people living considerably more than 65 just over 5% and this number is the lowest among three countries during this period.

In the next 20 years, the percentage of three countries are predicted that will almost increase. There was an dramatically growth in Japan in the 1930s with the highest percentage will be at 25%. In 2040, it is thought that nearly 28% Japanese will be 65 and more, while the figure for Sweden and the US will be more gradually lower at 25% and approximately 23% respectively.

  • Screenshot146.png


Holt  Educational Consultant - / 15461  
May 16, 2020   #2
The summary overview is complete in content. However, the presentation will not help your GRA score as you did not use individual sentences to portray the information within the chart. Remember, the complex sentence has an independent clause and at least one dependent clause. These must present one clear idea to the reader. When you combine information into one long presentation simply using the word "and" to separate your data, that is a run-on sentence. You opt to use at least 2 independent clauses in the same sentence without an appropriate conjunction or a punctuation mark to separate the presentation, you have not created a complex sentence. The summary overview will definitely pull down your GRA score due to the lack of proper simple and complex sentence presentation. However, you did show that you are capable of using other punctuation marks. Although, your use of the parenthesis would have been a stronger GRA score consideration had you used a comma before the word "and" in the presentation. The comma would have added clarity to the listing of countries. Each country is independent of the other so a comma clarifies that separation.

To clarify, an American is a person from America. America is the country where the American comes from. Differentiate between the national identity and the country or origin of a person (America has the highest...) . That is an LR deduction on your part. Misuse of the word or usage of a word in the wrong context.

Additionally, a future prediction needs to use future verb tenses in its presentation since the action is yet to take place (Japan predicts that it will replace...)

There is a grammar rule that goes "A before consonants, an before vowels". Kindly remember that in your presentations (There was an dramatical growth = There was A DRAMATIC growth)

Work on your paragraph presentations. Avoid run-on sentences so that you will meet the minimum 3 sentence requirement for the paragraph. You did well in terms of the word count but your sentence presentation skills are lacking. Your main problems in scoring will be in the LR and GRA sections because of the current errors that your presentation shows.


Home / Writing Feedback / The line graph illustrates the number of people aged 65 and more - over 100 years period
ⓘ Need Writing or Editing Help?
Fill out one of these forms for professional help:

Best Writing Service:
CustomPapers form ◳

Graduate Writing / Editing:
GraduateWriter form ◳

Excellence in Editing:
Rose Editing ◳

AI-Paper Rewriting:
Robot Rewrite ◳