Unanswered [2]
  

Home / Writing Feedback   % width   Posts: 4


IELTS Task 1 The line graph illustrates the percentage of different age groups of cinema visitors


chii0430 1 / 1  
Jun 24, 2021   #1

cinema visitors numbers


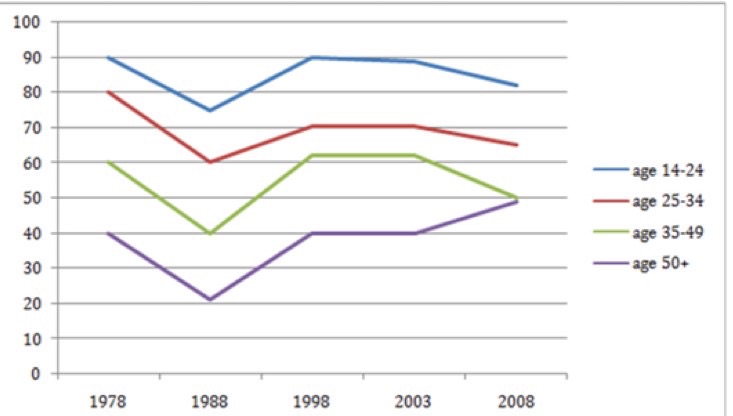
IELTS Task 1 The line graph shows the percentage of different age groups of cinema visitors in a paticular country.

The line graph illustrates the guests of four indivisual groups divided by their age in a certain country during five different years. Over all, the youngest group which represnts age 14 to 24 was the majority of the visitors of the movie theater over 1978 to 2008. In contrast, the oldest group was not really into watching movies in the cinema during the period.

Looking in the data in more detail, the people in 1988 were less likely to go watching movies comparing to whom in 1978. This led to a massive decrease of the number of visitors. However, things had gotten better since 1998, more and more people were willing to go to the theater. Consequently, the figure shows a noticeable growth. During 1998 to 2003, the number of clients of the cinema remained steady. Finally in 2008, the oldest group which stands for people over 50 years old had a slightly rise while the others fell.

To all who clicked into this page, this is my first attempt to practice IELTS writing test. I'm still learning and practicing to fulfill my goal. Thanks for your advice :D.

  • S__10788898.jpg


Holt  Educational Consultant - / 15461  
Jun 25, 2021   #2
This is a good first effort. The writing shows that the author analyzed the content for the presentation, but lacked guidance in terms of formatting and word count. These problems can be easily addressed and corrected.

The writer must take note of the basic Task 1 paragraph format. That is, a single image analysis should cover no more than 3 paragraphs. 2 comparison images can be analyzed over 4 paragraphs (if applicable). Additionally, while the minimum word count is 150 words, the most ideal word range is within 175-200 words, written within 20 minutes. This is the word count that can bring maximum scoring considerations provided the analysis presented is on topic.

That said, the formatting error in an otherwise strong analysis presentation is easy to spot.. The summary overview would have also benefitted from a more thorough listing, not discussion of the 4 age groups provided. Afterall, the summary paragraph requires the presentation of the basic data that will comprise the analytical paragraphs. The paragraph division could have been:

Par. 1 : Summary overview + trending statement
Par. 2 : Comparison of group 1 and 2
Par. 3 : Comparison of group 3 and 4

There is no concluding paragraph requirement for a task 1 essay.
heyaaami 2 / 4  
Jun 25, 2021   #3
divided by their age-> divided into 4 age groups
the oldest group, which stands
OP chii0430 1 / 1  
Jul 3, 2021   #4
@heyaaami
@Holt
Thanks for your comments and advice!
I really appreciate that!


Home / Writing Feedback / IELTS Task 1 The line graph illustrates the percentage of different age groups of cinema visitors
ⓘ Need Writing or Editing Help?
Fill out one of these forms for professional help:

Best Writing Service:
CustomPapers form ◳

Graduate Writing / Editing:
GraduateWriter form ◳

Excellence in Editing:
Rose Editing ◳

AI-Paper Rewriting:
Robot Rewrite ◳