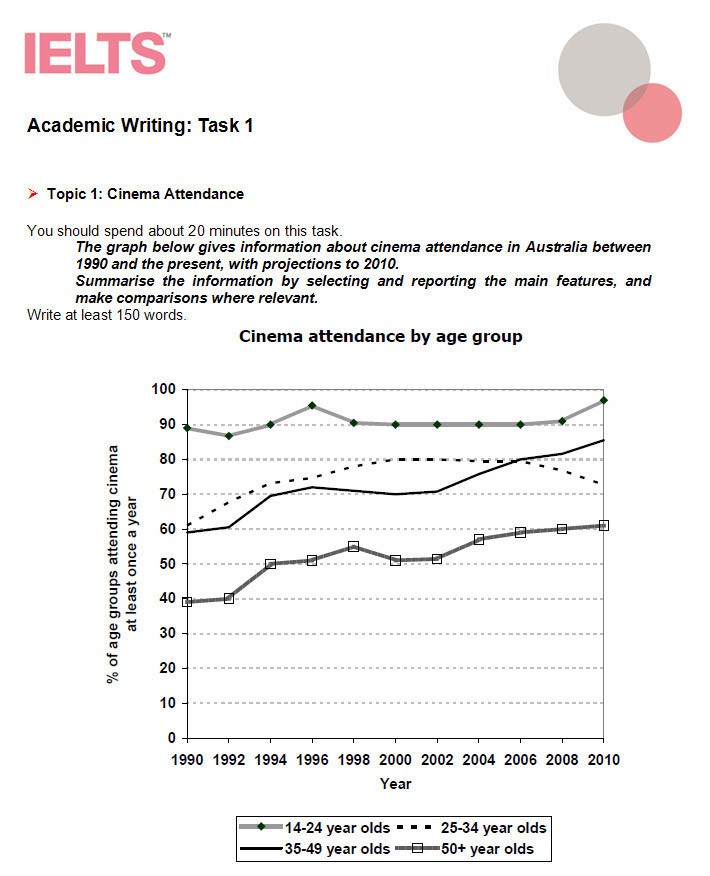
The line graph illustrates the percentages of four different age groups attending Australia's cinema at least annually. The time began with 1990 till now, with predictions to 2010.
It is clearly that the age of 14-24 year olds group has the highest percentage than other three groups. It reached 95% at 1990 then dropped 5% and kept remaining stable for a while. It is predicted that in the future, the percentage will go upward from 2008. As to the groups of 35-49 years old and elderly age, the percentage of attending cinema increased gradually. The age of 50+ year olds' percentage started with 40% and slightly fluctuated from 1994 to 2000. The percentage will rise gradually from now on. As to the middle age began with 60% and remained stabilized over a period. It is anticipated that the percentage will increase rapidly from 2002.
The percentage of 25-34 year olds' group is adverse to three other groups. The group started with 60% and showed dramatic uplift that reached the highest 80% at the year of 2000. The percentage forecasted will stay unchanged for a while and will plummet sharply till 2010.
Overall, youngsters have the highest percentage in attending Cinema in Australia. Surprisingly, the group of 25-34 year olds' group become rarely into watching movie in Cinema anymore.

Task1.jpg
