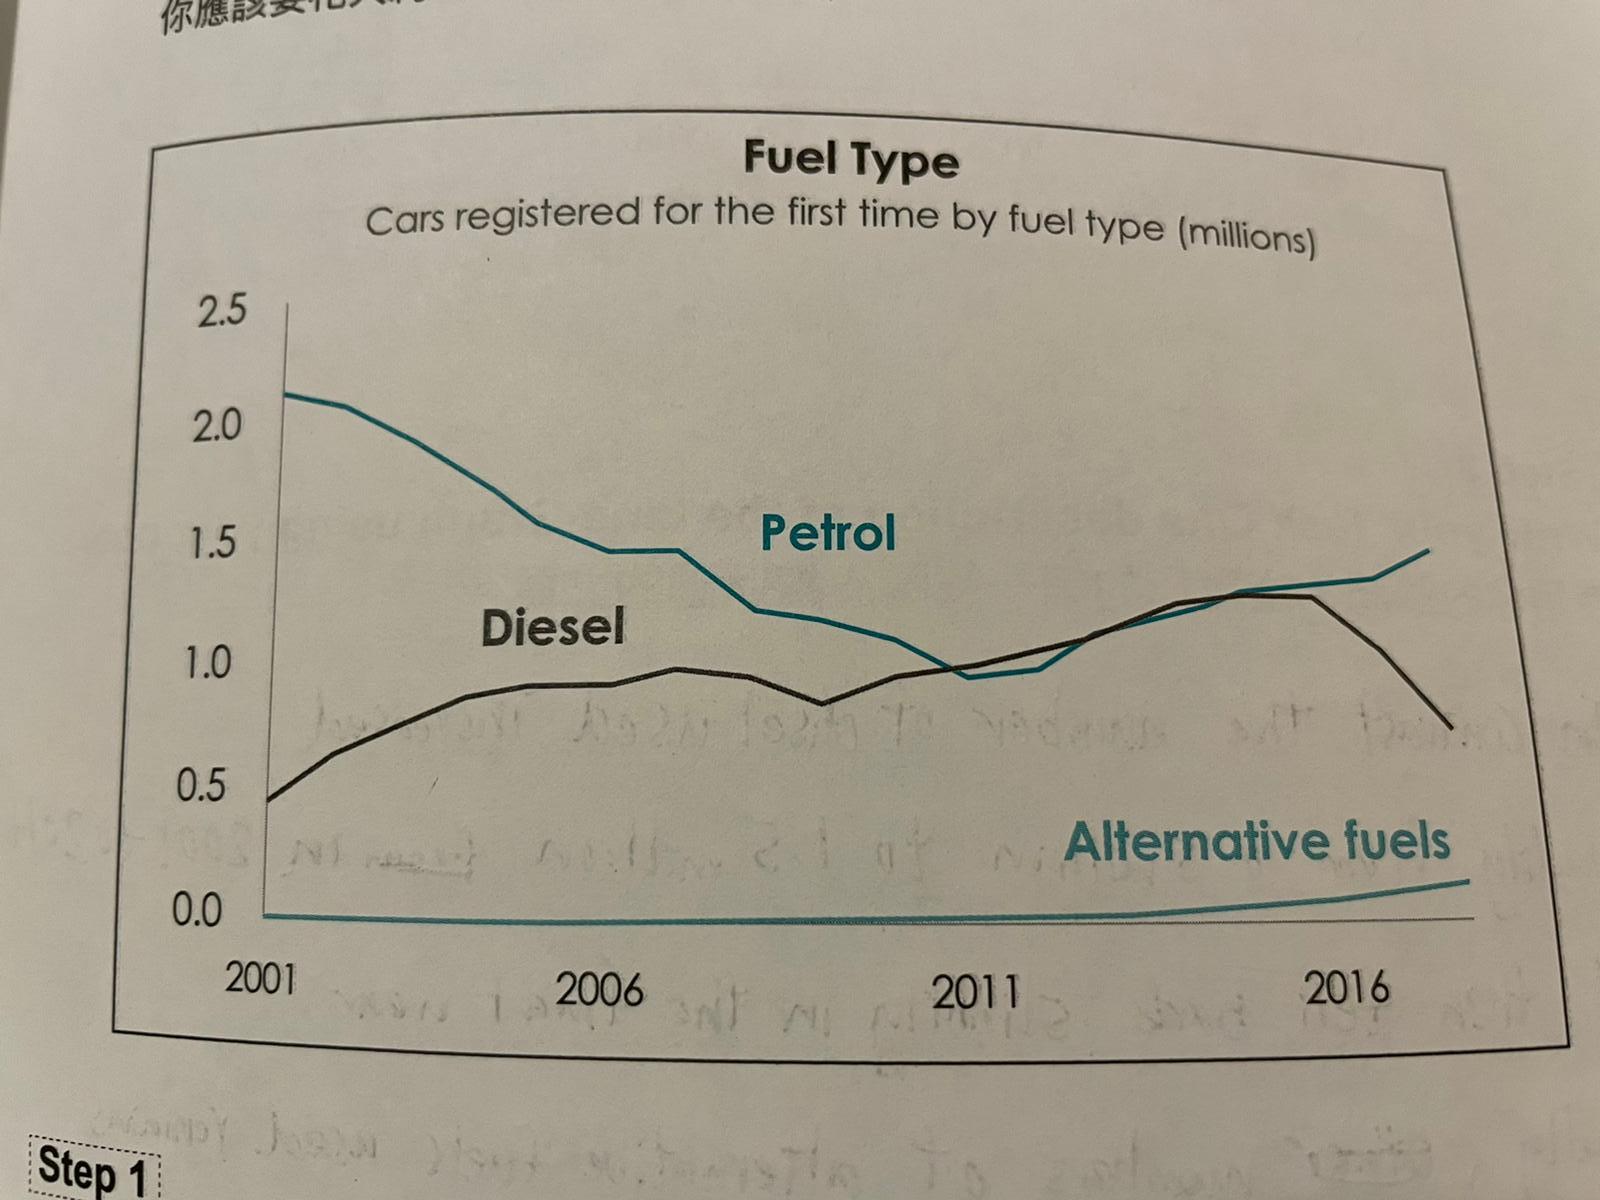
The chart below shows the number of cars registered for the first time by fuel type from 2001 to 2016.
MY ANSWER:
This chart hightlights 3 type of fuels used for the first time by registered cars from 2001 to 2016.
Number of petrol used started at 2 million and has a downward trend in the first decade.
After reaching a trough of approximately under 1 million in 2011, there was an increase of about half a million for the next 6 years.
In contrast, the number of diesel used had slightly rose for 15 years before it fell rapidly by 1 million to 0.5 million within 5 years.
By a wide margin, Alternative fuels was not used in the first decade. Instead, starting from 2011, it was moderately increase by about two hundred thousand.
Marking it as the least poplar fuel used by car.
Summarise the infomation by selecting and reporting the key features and making comparisons where relevant.
MY ANSWER:
This chart hightlights 3 type of fuels used for the first time by registered cars from 2001 to 2016.
Number of petrol used started at 2 million and has a downward trend in the first decade.
After reaching a trough of approximately under 1 million in 2011, there was an increase of about half a million for the next 6 years.
In contrast, the number of diesel used had slightly rose for 15 years before it fell rapidly by 1 million to 0.5 million within 5 years.
By a wide margin, Alternative fuels was not used in the first decade. Instead, starting from 2011, it was moderately increase by about two hundred thousand.
Marking it as the least poplar fuel used by car.

CARREGISTERED.jpeg
