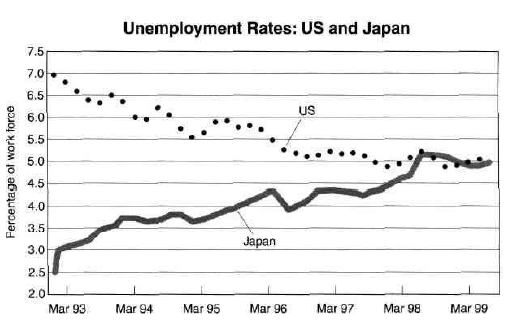
The graph below shows the unemployment rate in the US and Japan between March 1993 and March 1999.
Write the report for a university lecturer describing the information shown below.
The line graph presents how many people have no occupation in two developed countries, the United States and Japan, between 1993 and 1999. Overall, it is immediately apparent that the difference between both figures became much fewer over a 6-year period. It is also noticeable that there was a down trend in unemployment rates in the US whilst Japan saw the reverse.
In March 1993, the number of people without any occupation in the United States was considerably high at 7.0 percent, while the Japanese witnessed more than twice lower than it. However, this trend bore no similarity in the latter period in which these figures became narrower, and they reached an equal point at 5.0 percent eventually.
By 1994, the percentage of unemployed American people had decreased gradually to 6.0, and it continuously flattened out to just over 5.0 in the following two years, before hovering in this point until the latter period. In contrast, the rate in Japan increased slightly from above 3.5 to 4.5 percent in 1996, and then it peaking at 5.0 eventually, showing a 1.5 percent-rise in a half decades.

Unemployment_rate.pn.png
