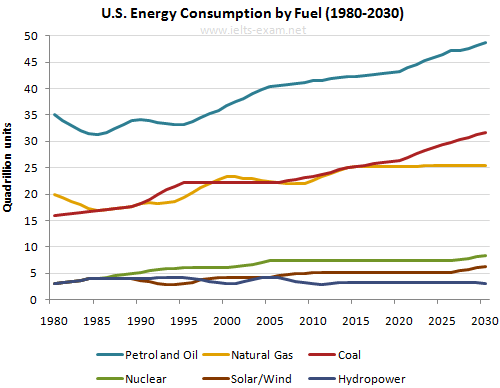
The line graph provides a breakdown information in terms of quadrillion units of energies which are petrol and oil, nuclear, natural gas, solar/wind, hydropower from 1980 to 2030 over a-40 year period. Overall, almost every single type of energy will be having an upward trend, except for hydropower.
The q of petrol and oil peaked at 35 as the highest q compared to other type of energy in 1980, while the q and nuclear, solar were the lowest ones. In the middle of the aforementioned energy, coal and natural gas both started off at approximately 17,5 q. As time went to 2030, the petrol and oil kept increasing to 50 q with a slight decrease between 1980 to 1990 and from 1990 to 1995, in the meantime, coal and natural gas simultaneously erect to both 27 q and 20 q, even though there were some fluctuation up and down from 1990 to 2015. The rest three types of energy have another story, nuclear and solar/wind, hydropower had some insignificant changes at some extent from 1995 to roughly 2003, but they will manage to almost remain constant to 2030. The final result for three types of energy are closely at 5 q.
The q of petrol and oil peaked at 35 as the highest q compared to other type of energy in 1980, while the q and nuclear, solar were the lowest ones. In the middle of the aforementioned energy, coal and natural gas both started off at approximately 17,5 q. As time went to 2030, the petrol and oil kept increasing to 50 q with a slight decrease between 1980 to 1990 and from 1990 to 1995, in the meantime, coal and natural gas simultaneously erect to both 27 q and 20 q, even though there were some fluctuation up and down from 1990 to 2015. The rest three types of energy have another story, nuclear and solar/wind, hydropower had some insignificant changes at some extent from 1995 to roughly 2003, but they will manage to almost remain constant to 2030. The final result for three types of energy are closely at 5 q.

IELTS_Writing_Task_1.png
