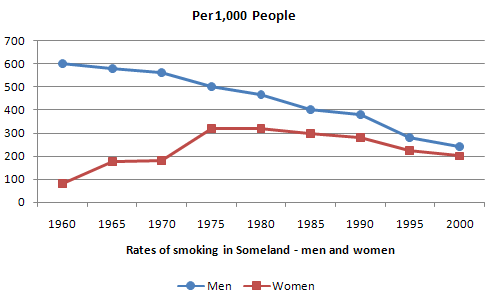
The line graph illustrates the number of men and women who smoke in Someland between 1960 and 2000. Overall, both the number of male and female smokers declined over a 40 year period.
To begin with, in 1960 there were 600 people who smoked were men, while the number of female smoker were significantly lower than male by 510 people. During the first 15 years, male smokers went down slightly about 500 people. In contrast, there was a steady increase in the number of women who smoked from around 90 people to a peak of 310 people between 1960 and 1975, despite the stabilization in the middle. For the next 15 years, people probably had more knowledge about the negative impacts of cigarette, so both the number of male and female smokers decreased, but male smokers dropped consistently by 180 people, whereas there was a gradual fall in the number of smokers who were women under 300 people. From 1990 to 2000, not only male smokers but also female smokers declined marginally by nearly 100 people.
In conclusion, it is clear to see that although the number of men who smoked had been dropped dramatically, it was still higher than female smokers.
Please send me the feedback soon as possible. Thank you. :)

G29.gif
