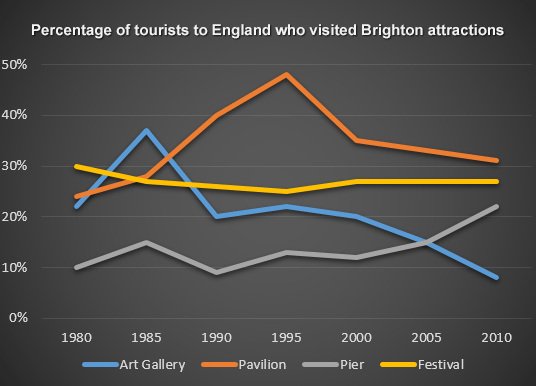
Line graph reveals the proportion of visitors who traveled four difference attractions in Brighton
number of tourists in a city - graph analysis
A glance at the line graph provided reveals the proportion of visitors who traveled four difference attractions in Brighton.
Overall, it is apparently from the data supplied that the number of tourists coming to Art gallery, Pavillion and Pier fluctuated whereas that of Festival remained almost unchanged during the period shown.
One particularly interesting facts highlighted by the figure is that just only a tenth tourists went to Pier, they more likely to visit Festival about 30% but then the percentage of Festival slightly fell to around a quarter by the year 1995. Pier had a minor fluctuation and steadily went up during the period.
When it comes to Pavilion which reached the peak at roughly a half in 1995 but significantly dropped about 30% in 2000 and remain decreased after 2000. Likewise, the figure of Art Gallery in the top of 38% in 1985 then showed a decelerate at under 10% in over two decades. Although, this was the lease popular attractions in Brighton at the end of period.It will be nice if you add the photo of this task next time! I will add the photo so other contributors can help you more.
Try to paraphrase your introduction so you can add a score in the vocabulary category.
Also, a lot of grammatic issues need to be fixed throughout the article like punctuations and conjunctions.
Good luck~~

IELTS_Writing_Task_1.png
@sanbe
Hello there! Welcome here. As I agree with the prior comment, next time just do not leave out adding the necessary graph to help us. Nonetheless, I'll do my best to provide you with writing feedback.
Structure-wise, I heavily suggest that you try to add more details to your written text in terms of writing techniques to help you organize your text. This includes, for instance, punctuation and pauses that will improve the overall flow of writing that you have.
Having said that and observing your second paragraph, I suggest that you add more details to your writing. Simplify your thought patterns to help readers understand your message.
| Home / Writing Feedback / Line graph reveals the proportion of visitors who traveled four difference attractions in Brighton |
ⓘ Need academic writing help? 100% custom and human!

