Unanswered [0] | Urgent [0]
  

Home / Writing Feedback   % width   Posts: 3


Line graph shows the number of overseas visitors to three different areas in Europe. Summarise info


raveelmer 1 / -  
May 24, 2023   #1

the proportion of coast, lakes and the mountain areas visitors


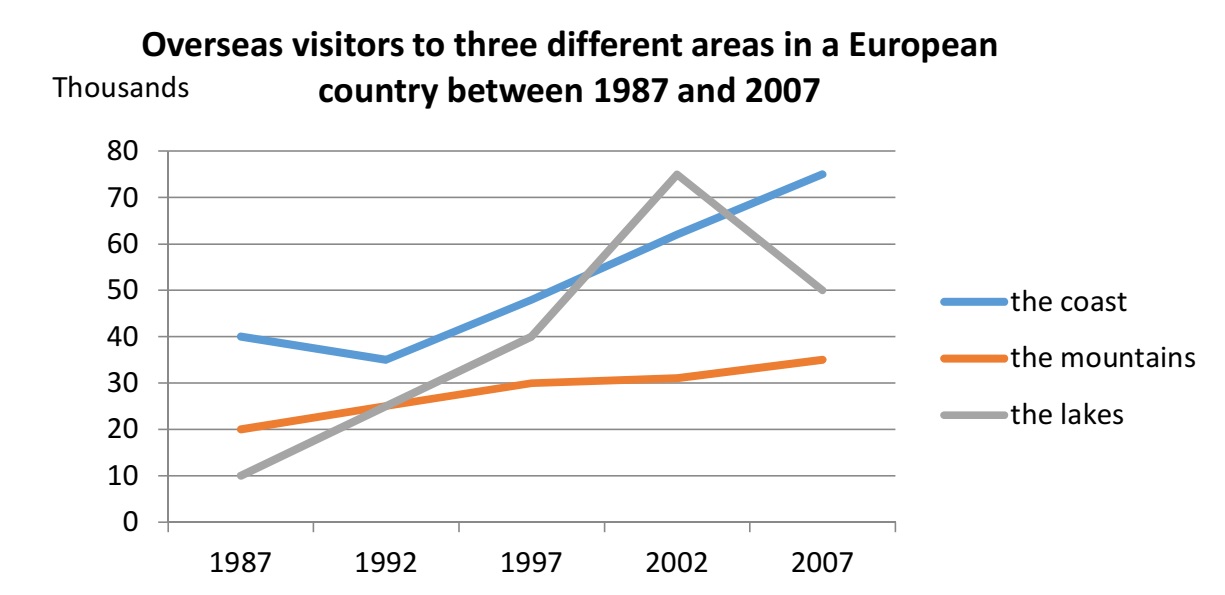
The chart demonstrates the data for visitors who visit 3 different locations including the coasts , the mountains and the lakes during the span of 20 years from 1987 to 2007

Overall , It is readily apparent that all three of these regions gained an increase number of tourists . In addition , the number for lake's tourists witnessed the most dramatic change among those given . It is also notable that the figures for the coast remained the highest while mountainous areas remained the least attractive travel option

In 1987 , the coasts attracted 40 thousand people while the converse held for those who choose the lakes with only 10 thousand . Over the next 20 years , the coast experienced a slight drop in the number of visitors by a few thousand , followed by a significant climb to around 75000 people at the end of the period . Similarly, the number of lake visitors saw a dramatic jump and reached its peak at about 75000 right before witnessing a gradual drop to 50000 in 2007

At the beginning of the period, 20 thousand tourists from other countries visited the mountains. The mentioned attractions welcomed 30 thousand visitors in 1997 and since then , the data continued to rise minimally and reached the highest point of 35000


Holt  Educational Consultant - / 15171 4859  
May 25, 2023   #2
including the coasts

You should only say "including" if there are other items in the list that you did not mention. In this case, there is no such list, therefore, you should not have said "including".

There is a lack fo clairty when it comes to identifying the type of graph that was provided for the image. Since there are line and bar graphs provided, depending on the type of graph image, you should be clear by indicating the type of graph you are reviewing.

Save for these problems, you did a pretty good job of analyzing the image presented. You really got as much clear information as you could into the paragraphs, which the reader can appreciate.
Nguyen Van Tich - / 1  
May 26, 2023   #3
@raveelmer
how can you up load the image in your post bro? can you teach me please,(thank you very much)


Home / Writing Feedback / Line graph shows the number of overseas visitors to three different areas in Europe. Summarise info
Do You Need
Academic Writing
or Editing Help?
Need help with your assignments? Fill out one of these forms:

Graduate Writing / Editing:
GraduateWriter form ◳

Best Essay Service:
CustomPapers form ◳

Excellence in Editing:
Rose Editing ◳

AI-Paper Rewriting:
Robot Rewrite ◳