Population growth
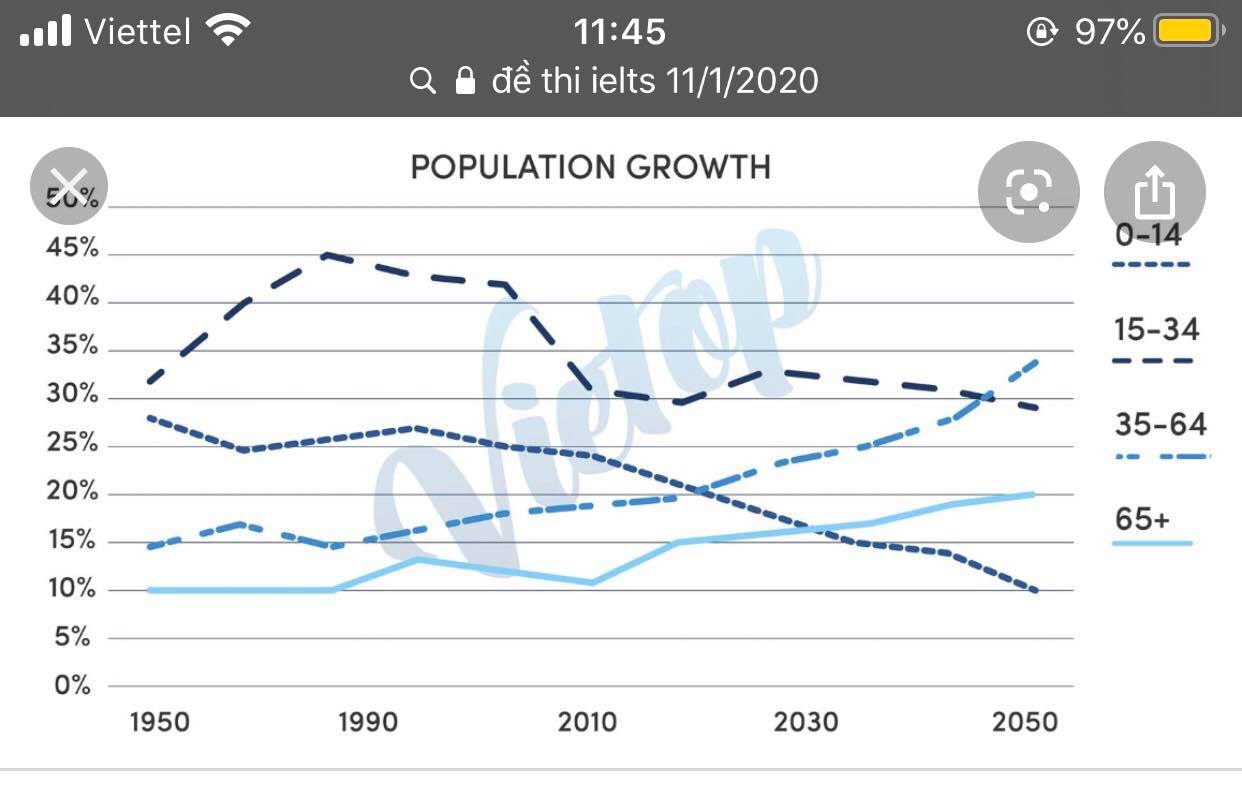
Task 1: The line graph shows the percentage of New Zealand population from 1950 to 2050.
The line graph illustrates the proportion New Zealand population growth based on four different age groups between 1950 and 2050.
Overall, it is clear that the percentage of people from 15-34 years old is by far the highest over the period shown. The proportion of elderly people over 65 is lowest by 2030 and predicted to rise until 2050.
In 1950, over 30% of New Zealand citizens fell into 15-34 group, followed by 28% of that was 0-to 14-years-olds. By contrast, only 15% of New Zealand population belonged to 35-to 64-years-old group, and the smallest figure - 10% of the population growth was seen in the group of the senior over 65.
From 2030 to 2050, the percentage of New Zealand citizens aged from 15-34 and 0-14 are expected to go down to 29% and 10% respectively in 2050. While the proportion of 35-64 year old people will continue to rise significantly and peak at about 34% , and the percentage of the elderly over 65 is predicted to increase gradually to around 15% in the year 2050.

95095386_16169230551.jpg
