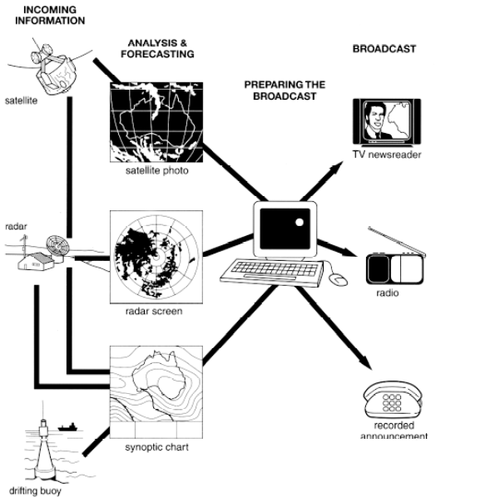
The production of weather and climate projection broadcast on electronic devices is presented in the process diagram. Although all of the data is proceed in the same computer, the steps differ initially in the data sources which account for the variation of analysis and forecasting information results.
At the first stage, three different data sources: satellite, radar and drifting buoy collect all of weather information from the space, land and ocean, respectively. Having been installed, each of the devices creates different signals in order to obtain various analysis and prediction reports. In this step, satellite transfers signals to provide satellite photo, drifting buoy's signals illustrate synoptic chart and radar is able to show the information into both of the radar screen and synoptic chart.
Subsequently, the whole facts come into the computer system in order to get the most accurate projection. This is where the process begins to unite. Lastly, the forecast report can be shared through electronic media like television, radio and recorded announcement once it is ready.

proses_1.png
