obese, those with ideal weight and underweight people in Charlestown
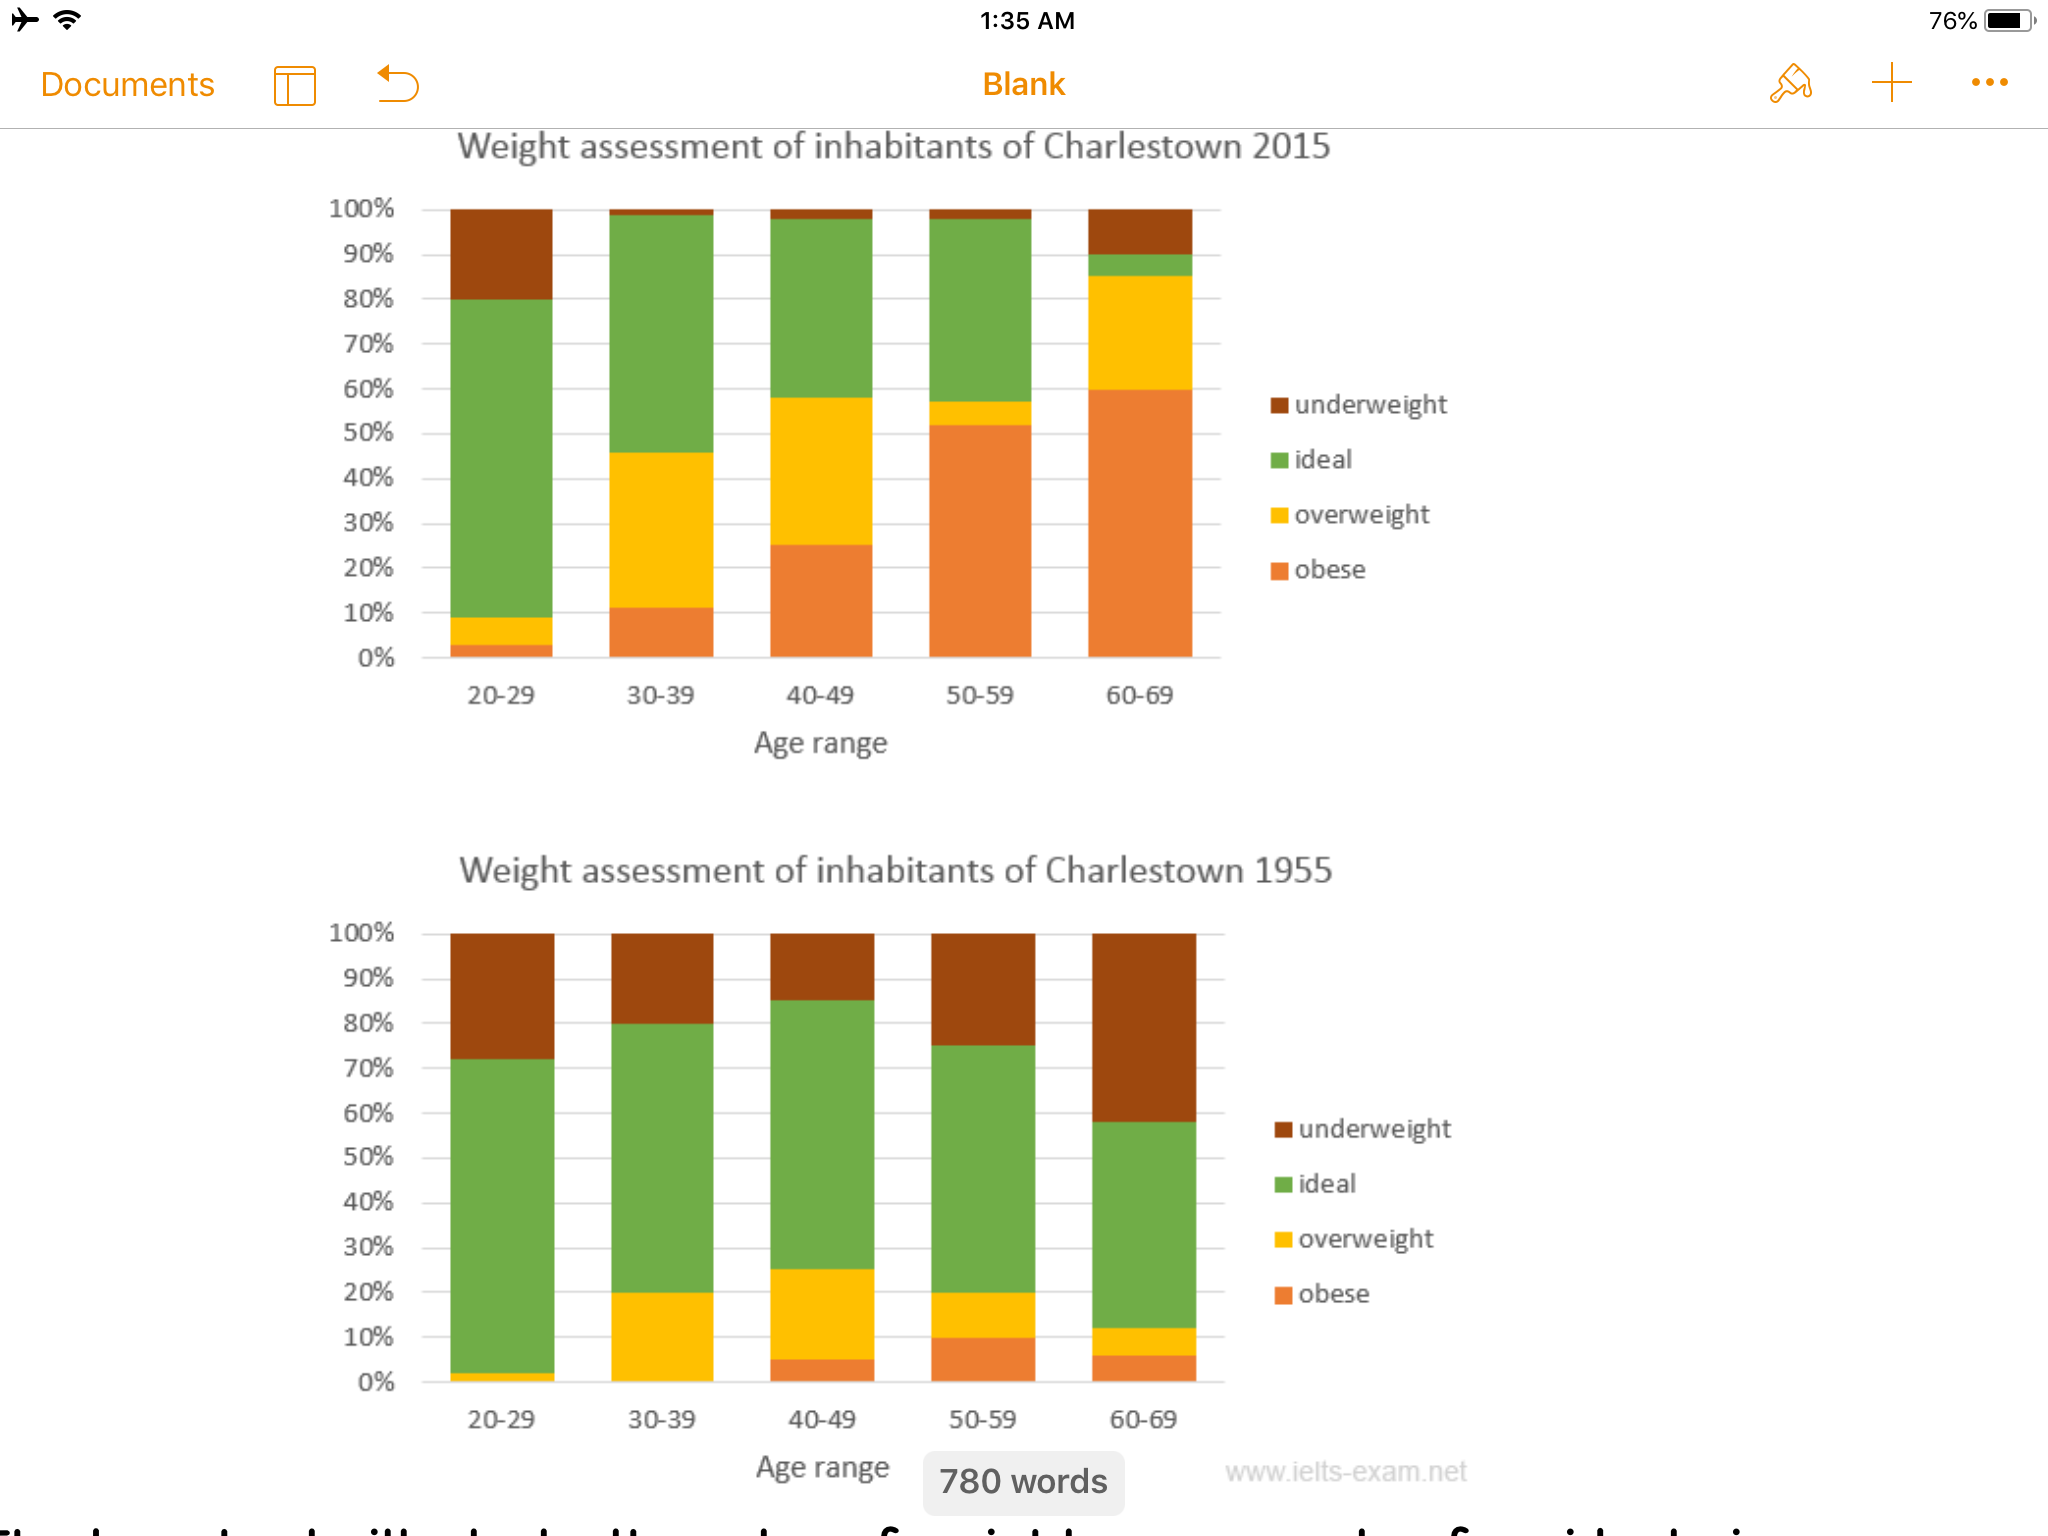
Writing task 1:Topic: You should spend about 20 minutes on this task. The charts summarise the weigh...The bar charts illustrate the rates of weight assessments of residents in Charlestown versus aging in 1955 and 2015.
Overall, from 1955 to 2015,ideal and underweight experienced a downward trend in all age groups. Meanwhile, overweight and obese showed a strong upward trend.
Regarding ideal criterion, it generally decreased with aging. In 1955, ideal weight hit the large-point around 70% in group 20-29 whilst other age ranges were lower and fluctuated roughly between 50% and 60%. Compared with 1955, the downward trend became more clearer in 2015. Specifically, the range 20-29 remained steadily about 70% and then saw a sharp decline especially in group 60-69 when it got approximately 5% which is only one tenth compared with it in 1955. Underweight also showed a similar trend which was went down with time but had fluctuations between age groups. It was worth noting that underweight in working age decreased and almost got 0% in 2015.
In terms of obese, it is obviously seen that obese increased with high speed with both time and age. In 1955, obese did not exist at the age under 40 and only registered the biggest rate which was 10% in group 50-59 but it got 5 times as big as in the same age range in 2015. Similarly, overweight generally had an increase especially in three groups 30-39;40-49 and 60-69. They respectively got 20%; about 20% and about 5% in 1955 whilst in 2015, the results were 45%;roughly 35% and 25%. There was an exception for overweight rate in the age range 50-59 when it went up marginally.

The chart
Holt Educational Consultant - / 15944 Linh, I know that you are often told that you should write as much words as you can in order to increase your scoring chances. The truth of the matter is that long essays do not equal a high score. Writing too many words, such as the 274 words that you wrote in this essay, could backfire because you do not have enough time to review your content for information accuracy, grammar usage, and sentence structure. The most efficient number of words to write, as far as I am concerned is anywhere from the minimum of 150 words up to 175 words at the most. Writing 200 words will already be a stretch because you will be sacrificing your editing time in the process. If you don't have time to polish your grammar usage and also, make sure that your paper is cohesive and coherent, then you will be taking a chance that your overall score will be low due to errors that could have been corrected before you submitted the paper. You need to make sure that you write just enough words for you to edit if necessary.
Your presentation suffers from insufficient information in the presentation. It also doesn't appropriately present a summary overview. Your comparison chart represents 2 different years for comparison based on the same criteria. This is not a versus presentation. Versus means against, opposed to, or in contrast to. In this instance, the information criteria is the same, just the measurement results changed. So the more proper term would be "comparative data" instead. A more proper summary overview for this information would have been:
2 bar charts, representing the weight of the inhabitants of Charlestown during the years of 1955 and 2015 were presented for comparison purposes. The age groups represented range from 20 - 69 years which were divided into 4 groups. The 4 comparison groups are composed of the underweight, ideal, overweight, and obese participants. The measurements were done in percentage form. The bar graphs shows that the underweight group had a downward trend while the obese group had an increasing measurement.
You need to make sure that your summary overview clearly lists the required information presentation because that will help you, as the writer, outline your presentation and make things easier for you to write. Along with that reason, is the fact that it will also help the reader get a better idea as to what your analysis will be about. The more complete your summary overview, the better your chances of receiving a higher TA score.
Do not keep repeating your trending sentence throughout the essay. That is not necessary. One mention is more than sufficient. By the way, do not use reference words that are not included in the graph. Mentioning terms like "working age", when no such reference in the graph is included tends to confuse the reader. Use only terms from the illustration. If necessary, use the specific age group mention. Do not deviate from the illustration information for TA and C&C scoring purposes.
By the way, it would be better if you can present a 4 paragraph format for your Task 1 essays as that is considered to be a better paragraph presentation. It allows you more room to develop your information presentation and also, gives you a chance to present all of the required information without making overly long, confusing, or run-on sentences as you did in this presentation.
You really showed the effort that you put into developing this Task 1 presentation and I applaud you for that. However, you made a few errors that you need correct on a permanent basis if you are to improve your presentation and scoring possibilities in the actual test. Keep writing and I will continue to guide you towards improving your work. This is an acceptable essay that makes me look forward to reading your upcoming Task 1 essays.

