Writing task 2 : Fitness membership
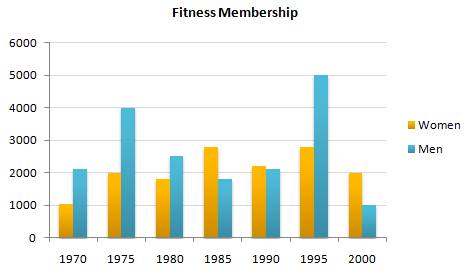
The bar chart shows the number of people becoming the fitness membership, starting from 1970 to 2000. Overall, it can be clearly seen that as long as 30 years the man had the highest rate of fitness membership and the lowest membership belonged to the women group.
In 1970, the number of women joined in the fitness membership reached the smallest figure at 1000 people and the women group registered in 1975 had the same figure as the female members in 2000 where the members attained 2000 people. The following five years, the rate of women members recorded 1800 people and increased even bigger to 2800 members in 1985 where it had the equal numbers with 1995.
The men members had the same number in 1970 and 1990 (2100 members), while the highest number of fitness membership was achieved by the men in 1995 (5000 members). In the next five years, the figure of the men members dropped sharply to only 1000 members. Nevertheless, 4000 men were recorded as the fitness membership In 1975.

14292292_10205840555.jpg
