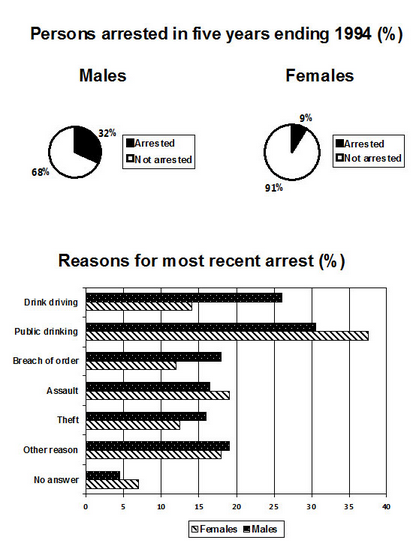
The pie chart reveals the percentage of men and women arrested, while the bar chart shows reasons why people were detained between 1989 and 1994. Overall, it can be seen that detention was more experienced by males than females, and the major reason why they were arrested was public drinking.
To begin, the total of the men detention was higher than the women. It was represented at 32% and 9% each. Furthermore, turning to the reasons for the most recent arrest, public drinking dominated the trend.
Firstly, males were arrested due to drink in public area and drink driving (roughly 31% and 27%), while breach of order, assault, theft, and other reasons was not popular. It was caused the percentage of these reasons showed solely under a fifht. Secondly, the factor which caused women hauled was public drinking, the number reached a peak at almost 40%, while other factors were not significant. The numbers showed two times lower than the rate of drinking in public area.

ES6.png
