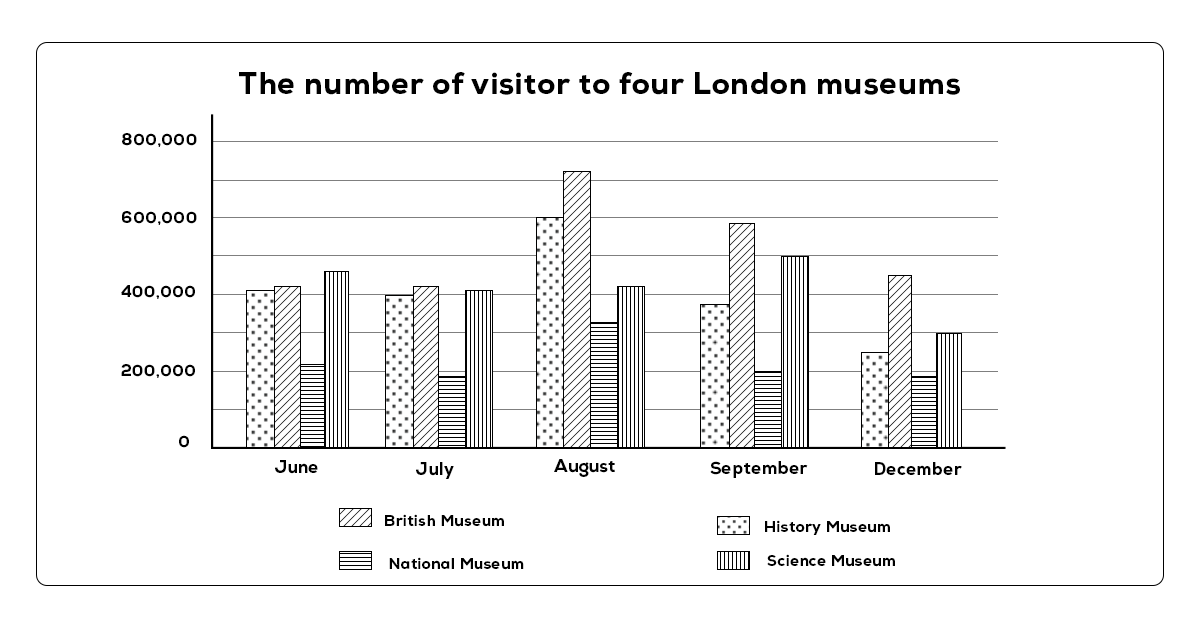
The number of visitors to four London museums
The line graph illustrates how many tourists came to four different museums from June to October in London.
In general, it is obvious that the number of people visiting all mentioned museums recorded a downward trend, while British Museum was the opposite. In addition, National Museum was consistently in the last place.
In the first two months, a similar pattern was observed in History Museum, British Museum, and Science Museum, with approximately 400,000 people. Meanwhile, the figure for that in National Museum reached a plateau at roughly 200,000 people. A striking feature was that August experienced significant growth in all museums apart from Science Museum, with over 700,00 people opting for British Museum, followed by History Museum and National Museum with 600,000 and 300,000 visitors, respectively. However, this figure in Science Museum remained unchanged at over 400,000 people.
Regarding the month of September, it is noticeable that both History Museum, British Museum and National Museum experienced a spectacular fall and a constant decrease in the last month. Furthermore, the number of holidaymakers traveling to Science Museum rose by about 100,000 people, compared to the previous month, before dropping dramatically to 300,000 visitors in October.

bar chart
