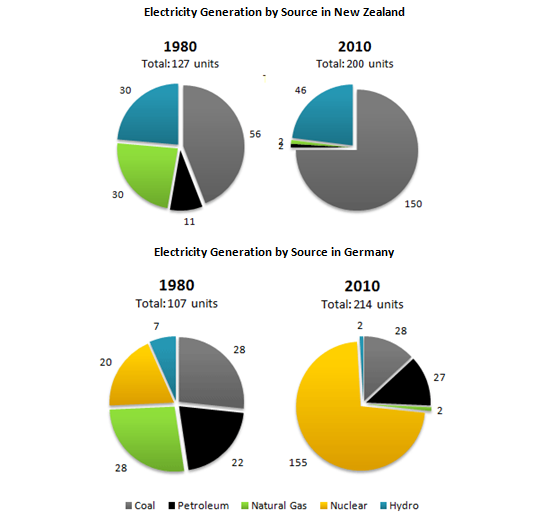
The pie charts below show electricity generation by source in New Zealand and Germany in 1980 and 2010.
A comparison of the information about source of electricity generation in Newzealand and Germany in 1980 and 2010 is depicted by the pie charts. Overall, the alteration of total sources in these countries was almost double in 2010. Nuclear power became the main source in Germany while Newzealand took coal as their main source.
To begin with, Newzealand experienced the biggest shift in the electric power source. In 2010, coal produced electricity twofold higher than 1980 which was about 56 units. Natural gas and petroleum source which were 30 and 11 units decreased at 2 units to each source. In contrast, hydro witnessed a slight rose from 30 to 46 units respectively in three decades
In 1980, the deployment of source used in Germany is almost equal, but in 2010, nuclear power gained the biggest units in the source of electric power. Nuclear power increased dramatically from 20 to 155 respectively whereas utilisation of natural gas and hydro which were 28 and 7 went down at 2. When coal did not experience the changing, petroleum rose slightly by 5 units

1.PNG
