Helloo,,, Friends My Name Is Khan...
This is WRITING IELTS TASK 1
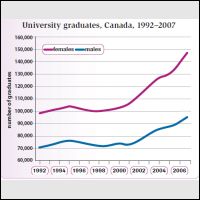
The following chart illustrates university graduate numbers in Canada based on sex from 1992 to 2007.
Graduate numbers over 15-year period got peak in 2007 but the number of female was always more than total of male. In 1992 both had slightly different numbers at just over 70.000 males and about 100.000 females. Inversely, in 2007 they had much more different increasing of the number of both. The total of female were well above 140.000. by comparison, the number of males was about 90.000. The line chart between female and male formed winder and winder.
A more detailed look at the graph reveals that the growth was not steady. From 1992 to 1995, there was steady climb, it was followed by slightly decreasing between 1995 and 2000. After 2000, there was strong increasing rate, from just about 100.000 to almost 150.000 female and male went up from less than 75.000 to 95.000 in 2007.
Clearly, the growth of them was similar, even thought graduate women were more than men.

228872_1.jpg
