Hi, I would appreciate it if you could check my sample report and essay. My exam is already on Jul 8..Thanks!
-------------------------------------------
WRITING TASK 1
You should spend about 20 minutes on this task.
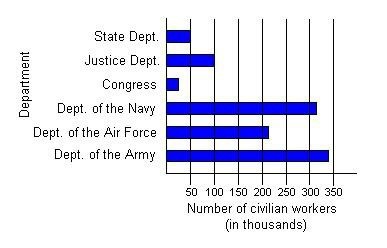
The bar graph below shows the number of civilians holding various federal government jobs.
Summarize the information by selecting and reporting the main features, and make comparisons where relevant.
Write at least 150 words.
please see attached image
----------------
The given bar graph shows data regarding the proportion of civilian workers holding various federal government jobs. Overall, it can be seen that out of the six different federal government jobs, most of the civilian workers opt to work with the Department of the Army.
As per the acquired data, almost 350, 000 civilian workers are working in the Department of the Army and this is consequently followed by the Department of the Navy, with a little over 300, 000 civilian workers. Moreover, many civilian workers can also be found in the Department of the Air Force with a total of a little over 200, 000.
On the other hand, this is in contrast with the number of civilian workers working for the Justice Department and State Department with only 100, 000 and 50, 000, respectively. More so, there are lesser civilian workers working in the Congress with almost half of those working for the State Department. Simply put, there is a noticeable difference between the number of civilian workers working in the Department of the Army and those in Congress.
-------------------------------------------
WRITING TASK 1
You should spend about 20 minutes on this task.
The bar graph below shows the number of civilians holding various federal government jobs.
Summarize the information by selecting and reporting the main features, and make comparisons where relevant.
Write at least 150 words.
Proportion of civilians holding federal government jobs
please see attached image
----------------
The given bar graph shows data regarding the proportion of civilian workers holding various federal government jobs. Overall, it can be seen that out of the six different federal government jobs, most of the civilian workers opt to work with the Department of the Army.
As per the acquired data, almost 350, 000 civilian workers are working in the Department of the Army and this is consequently followed by the Department of the Navy, with a little over 300, 000 civilian workers. Moreover, many civilian workers can also be found in the Department of the Air Force with a total of a little over 200, 000.
On the other hand, this is in contrast with the number of civilian workers working for the Justice Department and State Department with only 100, 000 and 50, 000, respectively. More so, there are lesser civilian workers working in the Congress with almost half of those working for the State Department. Simply put, there is a noticeable difference between the number of civilian workers working in the Department of the Army and those in Congress.

Writing_Task_11.jpg
