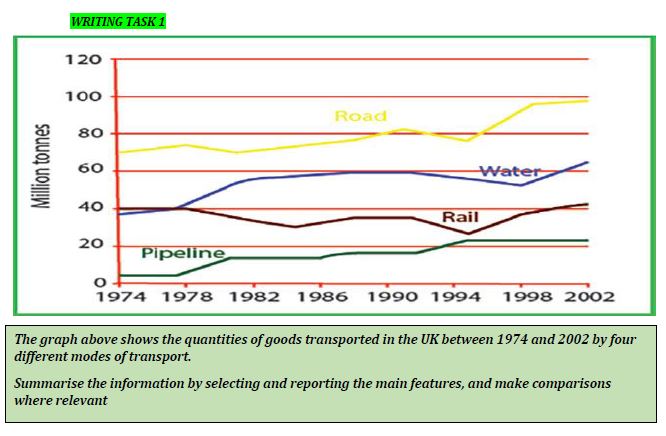
The line chart displays the number of commodities transported in United Kingdom from 1984 to 2002 using various kinds of transportation method in million tones. Overall, over 28 years, the trend of each kind was tended to be stable and increased slightly and also most of people like to use Road, otherwise look like they used pipeline in a few times.
It can be seen that Road placed as the highest among all almost 30 years. Started at about 70% in 1974, then grew moderately until reached a little below 100. In contrast, pipeline lied in the lowest position that set about 5 in 1974 then went upward marginally to above 20.
Besides that, in the first year, between rail and water have very small difference, 40 and a slight below 40. However, in 1978, both of them have the similar amount at 40, and after that water become higher than Rail until 2002, 65 and 42 respectively.

assignment_3_task_1..jpg
