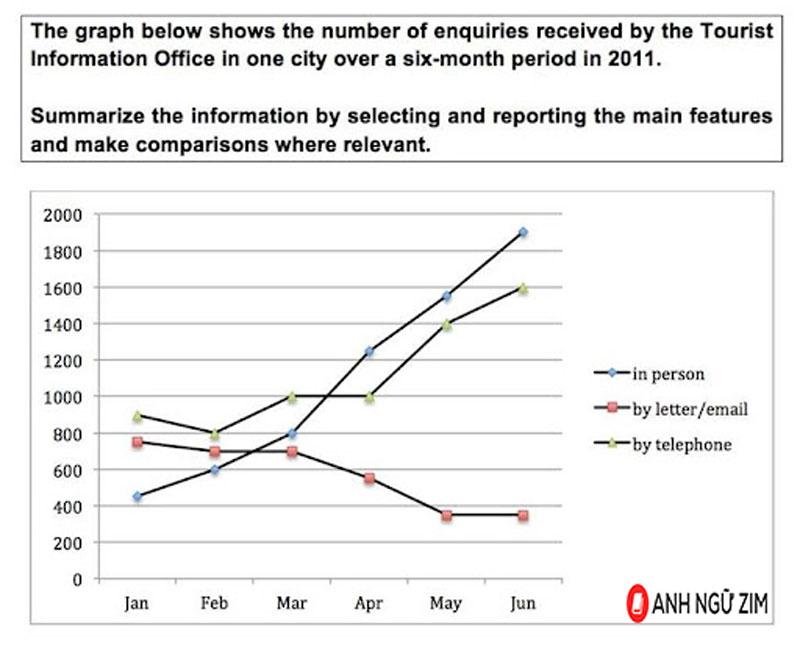
The line graph indicates the changes in the number of inquiries that were sent to the tourist information office in three different methods during a duration of six months in 2011.
Overall, the number of inquiries that were done in person and by telephone witnessed an upward trend, while the figure for letters showed a downward trend. Moreover, in-person inquiries were the most popular option.
Started with only 410, the popularity of face-to-face inquiries weakly grew to 800 in March. Afterward, it surged up and reached a peak at 1900 in the final month of the timeline. There were 900 inquiries done by telephone in January before increasing slightly to 1000 during the next two months. The figure remained steadily from March to April, then rocketed to 1600 in June.
In contrast, the number of emails that resembled inquiries was 790 in the first month. This figure witnessed a slow decrease to 700 in March, followed by a plunge of 310 by May before stabilizing at 390 between the last two months.

thenumberofenquir.jpg
