chart analysis - magazines sold in five countries
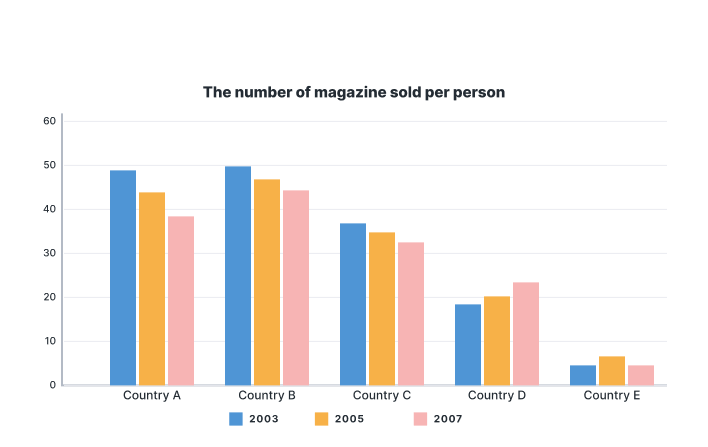
The given bar chart illustrates the number of magazines sold per person in five coutries between 2003 to 2005, with projected sales for 2007.
In general, it is clear that the percentage of magazines in country B in 3 years highest. In contrast, the proportion of magazines sold per human in coutries E was lowest.
It can be seen that 3 coutries: A,B and C decreased slightly in turn. In 2003, the percent of magazines sold in countries B and A approximately. Besides, in 2007, the proportion of that quite different. Country B compared with coutry C was higher than. For example, in 2007, the share of magazines people bought in country B around 45%, while country C less than 40%.
In country D, the number of magazines sold per person slowly climbed, about 19% to 25%. Alternatively, country E uneven decreased and increased, its highest in 2005.
In conclusion, the percentage of magazines sold per person in three countries: A,B and C gradually decreased in 2003 to 2007. Country E did not change significantly

t10107.png
